ª it doesn't include the Mission Sucre students
On the other hand, we designed a stratified sample (public institutions, private institutions) with proportional distribution. Table 2 summarizes the final conformation of the same one.
Table 2: Conformation of the sub-samples in each Barinesa HEI
Every student was asked about the educative uses of Internet, skills in the technology handling and academic performance. Altogether, 410 questionnaires were answered. With a 95% of confidence it can be affirmed that the error attributable to the sampling and other random effects is ± 5% (Arkin & Colton, 1965). Additionally to the sampling error, the way in which the questions were formulated and the practical difficulties to carry out the survey, can be introduce some additional error or inclination in the results. The type and design of research adopted was non experimental, cross-sectional, descriptive, causal, with quantitative approach.
RESULTS AND DISCUSSION In this section, the principal findings obtained throughout the research development are discussed. The information contained in this section, has been carefully organized according to the following scheme:
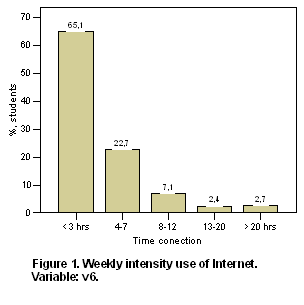
Technological profile of the Barineses university students From the analysis of Figure 1, it is deduced that among the local university students, that are Internet users, the intensity of use of this tool can be catalogued like moderate. A Little more than a third (34.9%) of them remains connected four hours or more a week. The percentage of students who exhibited an intensive use of the network - more than 12 hours weekly – only reached at 5.1%. If we compared these numbers with the intensity of Internet use showed by the American college students - 74% more than four hours weekly and 19% over 12 hours (Pew Internet & American Life Project, 2002) - will be clear why the Internet intensity use of the local college students is described as moderate. Nevertheless, a considerable 37% of the Barineses college students, uses most of the time of Internet connection (more of 50%), in activities related to their studies.
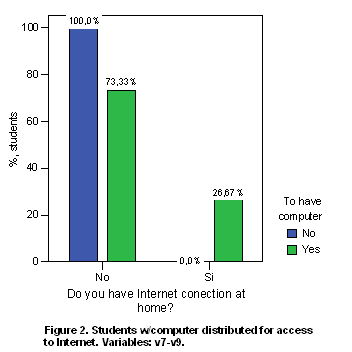
The local college students who had a PC at home - with its respective peripheral ones - reached a 33.2%, and of them, those who had a Internet connection from the comfort of their houses, reached 26.67% (Figure 2). According to the article of Perez Diaz (2006), at level of the Venezuelan population in general, the availability of computers in the home is commonest in the AB class (64.1%) that in the E (7.3%). Of those computers, they were connected to the Network in AB class (28.2%) and in the E (1.4%).
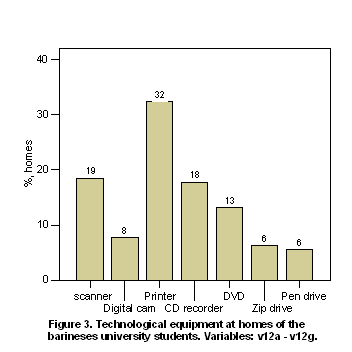
According to Figure 3, the printers (32%) were the peripheral one commonest in the homes of the Barineses young people, followed by scanners (19%) and the CD recorders (18%). Returning to the data contributed in the article of Perez Diaz (op. cit.), seems that the use of the technology is reinforced more and more in the Venezuelans, and therefore in the Barines. This tendency is more frequent as the age of the person is younger and the level education higher. According to the data that they contribute, the cellular telephone is present in 85% of AB class and in the E, the index of penetration reached 54.2%. Young people are the main users of MP3 players with 43.6% in segment AB. The digital camcorders have a masculine rate of penetration of 30% in the ABC class. The digital cams are used mainly by the ABC class in a percentage that reaches up to 28% of the population. Additionally, in AB classes the penetration of the DVD players is of 80%, while in class E is 35%.
The frequency with which the Barineses college students use the computer in the studies, varied substantially, from one university to another (Table 3). The patterns of use of the computer grouped themselves in three categories, that is to say: High (Every day), Medium (Once for week) and low (Monthly, occasional or never). In the UNA, a 23.3% of their students reported a low level use of the computer, compared with the low percentage in this category (3.6% and 8.5%) shown by the IUTAJS and the UNELLEZ. In the IUTAJS and the IUPSM, the students showed the highest percentage of the computer daily use, with an 85.5% and 75.0%, respectively.
Table 3: Frequency use of the computer in the studies, in each Barinesa HEI
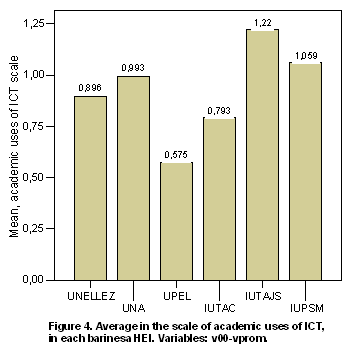
On the other hand, related to the intensity of use of ICT as a tool in the academic activities, among the local university students; it emphasizes in Figure 4 that the university institution where there is a more intensive use of the technology, was IUTAJS (
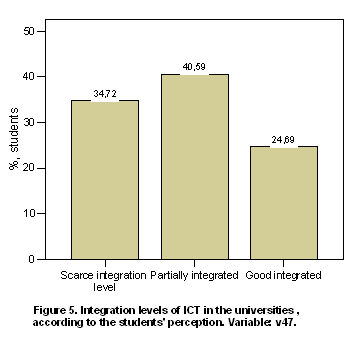
In the following question, the students were interrogated about the general perception they had in relation to the integration of ICT in its studies. As it shows Figure 5, three fourth parts of the Barineses university students consider that the technology is little or partially integrated in the pensum of their careers (75.31%). Hardly a 24.69% considered that the ICT was well integrated in their university. When this variable was examined, discriminating by institution, were substantial differences among universities. In some of them the opinions of the students about the integration level of ICT, clearly they were divided. Like in the cases of the IUTAC and the UNELLEZ, where to the total of students who thought that the ICT was partially integrated in the pensum, these institutions contributed to 32.79% and 30.84% respectively. As well, these same universities contributed to 27.72% and 20.79%, to the total of students who considered that the ICT was well integrated in the studies.
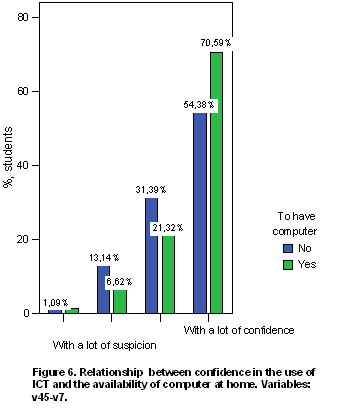
The confidence of the students in the use of ICT in the studies, varied among universities, although in all, the majority of the students was in the two higher levels of the indicator (Figure 6); and students' percentages that proved to approach to the technology with Little or a Lot of suspicion, turned out to be very small – so much among the owners of PC like among not owners -. The UPEL and the UNELLEZ presented students' lowermost percentages with a lot of confidence in technology. It is not a surprise that between 0 % and 20 % of the students yield any apprehension with ICT once their probable deficiency of knowledge about their careers expected by themselves. The confidence in ICT was influenced lightly for the field of studies, with the majority of the scientists and engineers (75.2 %) and to a lesser extent the students of Sciences Health (33 %), reporting high confidence levels in the same.
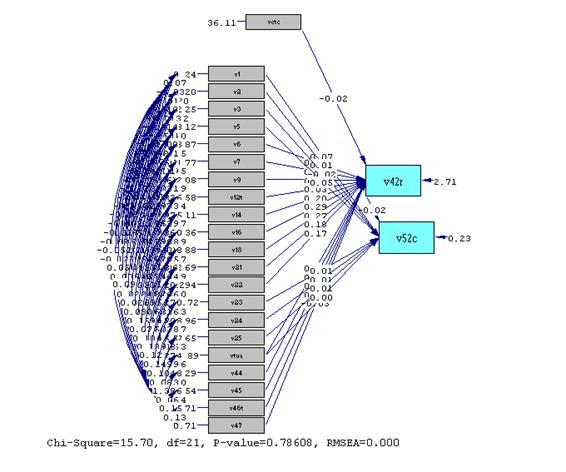
Model of causal relations among educational uses of the ICT, technological skills and academic performance of the Barineses university students To complete the quantitative analysis of the possible causality relations among the educational uses of ICT, technological skills and the Barineses university students' academic performance, it was used the technique of structural equations modelling with observable variables, by means of the utilization of the LISREL© program. The goodness of fit measures revealed that the path analysis proposed (Figure 7) represent the empiric data adequately. In fact, the root mean square error of approximation ( RMSEA ) was to the almost perfect level of 0,000, with a normed fit index ( NFI) of 1,00 and a comparative fit index (CFI) also of 1,00. The path analysis for the local students' technological skills evidenced appreciable effects of the majority of the indicators on the number of applications, that Barineses university students declared themselves to drive independently (Table 4a). The highest effects came, in the first instance, of an aspect pertaining to the surroundings of the student and, in second instance, of indicators that they relate with your individual behaviour in front of ICT. The possibility of having access to Internet from the PC installed at home had the biggest effect in the model (b=.57) 5. They kept on in order of importance: The confidence in the use of ICT in the studies ( b=.35 ), the experience with e-Learning's elements that the student was having ( b=.31 ), the years using a computer ( b=.29 ), the number of accounts of e-mail ( b=.27 ), the frequency of use of the PC in the studies ( b=.20 ), the fraction of the weekly connection time dedicated to the academic work (b=.18) and the years of experience using the Internet (b=.17). Engaging in good educational practices related with technology, that previous researches have highlighted his positive effects on the student success , had also an impact , although modest much more than the previous ( b=.07 ). It is important to notice that although the loading of this exogenous variable was small, its level of meaning was the highest among all the variables of the model (significant at level .001).
Table 4a: Structural Equations Model for ICT Skills Index and Academic Performance. Endogenous variable: ICT Skills Index
* p < .10 (The parameters of the model that proved to be significant to this level, you would have
The part of the path analysis referring to the Academic performance of the Barineses university students revealed effects of, very little relevance, of the indicators considered in the model on this one endogenous variable (Table 4b). Thus, indicators related to status socioeconomic of the student, such as: educative and professional level of the father had the strongest effects (b=.014; b=.011). Nevertheless, only the second was significant at level .05. These results seem to support, the often highlighted thing in literature on the subject, in relation to the difficulties found until now by the researchers, to demonstrate the effectiveness of the use of ICT on the results in the studies; and it again puts in centre of the debate the paradox of the no significance (Russell, 1999).
Table 4b: Endogenous variable: Pondered Academic Performance
* p < .10
A possible explanation of this result can be deduced if we reviewed the findings found by Wenglinsky (1998), who used models of structural equations to explain the results in the mathematical subject in students of fourth and eighth degree of basic school in the U.S.A. He found, among other important findings, that the effect of the ICT use on the academic performance can be very different in students immersed in a rich atmosphere in technology than on those in more conventional surroundings. According to that premise, since it doesn't fit to the reality to say that the Barineses student university are habitually in atmosphere highly techno, we can assume that the impact of ICT on the results in the studies, can be attenuated by the conditions technological of the context. In agreement with the previous reasoning, the technological equipment of the university centres (intervener variable) did not have a significant effect on the technological skills of the students (b=-0.020). Based on this result, it is considered that it is not the same that all the students have a computer in their classrooms or that they share a PC among several or there is computer science laboratory in centre, where students go from time to time. In this last configuration, it is expected that the effects of the use of ICT on the results in the studies were weaker than in the first configuration. This situation, in our opinion, is reflected by the causal model. Figure 7 shows the causality relations among the diverse exogenous variables - indicated in the Tables 4a and 4b - with the technological abilities and the academic performance, reported by the Barineses university students.
Figure 7: Causality relations among the diverse exogenous variables considered in the hypothetical model and the dependent variables: ICT Skills Index and Academic performance.
Finally, as it is reported in the bibliography, different models can exist and, they can reach statistically consistent results. For it the previous model with a saturated model was confronted, that implies that all the variables included in the model, are related to each other, and a model where all the studied variables establish solely direct influences (they are independent). The results indicate that the proposed model reaches results more excellent than the saturated model and the independent model; the results suggest than the proposed model attains more relevant results than the saturated model and the independent model; for example, when comparing the values of expected cross-validation index (ECVI) 6 of these three models we met than, for the proposed model ECVI 1,44 while that for the models saturated and independent, the values of ECVI were 1,55 and 9,85 respectively. These values contribute to give greater sustenance to the obtained findings.
CONCLUSIONS The majority of the goodness fit statistics for the hypothetic causal model proposed (Figure 7), revealed that the same, represent adequately the empiric data collected by means of the questionnaire application. These results suggest that the mesh of causality relations in the model was confirmed by the observed data. The path analysis for the technological skills of the local students, demonstrated appreciable effects of indicators like: a) to have access to Internet from the PC installed at home, b) the confidence in the use of ICT in the studies, c) the experience with certain elements of e-Learning, d) the account number of email that the student had, e) the years using a computer, f) the frequency of use of the PC in the studies, g) the fraction of the weekly time of connection dedicated to the academic work, h) the years of experience using Internet and i) to get involved in good educative practices related to the technology. The indicator referent to the technological equipment of the Barineses university centres did not affect significantly the levels of e-Literacy (scores in the ICT Skills Index) of the students. The part of the path analysis referring to the Academic performance of the Barineses university students revealed very little important effects of most of indicators considered in the model, on this one endogenous variable. Thus, only an indicator related to socioeconomic status of the student, that is to say, the professional level of the father had a significant effect. These findings agree with the conclusions reached in frequently mentioned Russell`s work (1999) who has said: "There is nothing inherent to the technology that causes an improvement in the learning.", although, "the process to redesign a course to adapt its content to the use of the technology can improve the course and improve the results". Or, the position somewhat more categorical of Bates (2001, pp. 243 - 244): Most of the teaching staff and of the postgraduates' students usually they begin to evaluate the relative effectiveness of the education based on the technology, compared with traditional direct education. Although this can be necessary to be able to integrate the most reticent professors, this plan concrete of research is frankly loss of time. The results are beforehand known. Consequently: The compound hypothesis of research (H1) was partially confirmed by the collected empirical data. The part of the hypothetical causal model related to the students technological skills - ICT Skills Index - received the greater amount of empirical sustenance. Contrary, the section of path analysis related with the students Academic performance only was influenced by the indicator: the father professional level. Finally, we expect that the information collected during this research, and the attained conclusions, have contributed to raise the understanding that one was having about the technology handling, skills and attitudes toward ICT, and the possible relation of these two factors with the results in the studies, in the Barinesa higher education.
Endnotes 1 ICT Skills Index means "Indice de habilidades en TIC". Simply, the person is asked about his/her capacity to accomplish determined tasks, alone or with a certain amount of help, using 10 applications software of common use. The punctuations in this index fluctuate in [0, 10]'s interval, depending on if the individual manages none or all applications. 2 In general, the term student engagement refers to the attitude, needs, desire or obligation of the student of participating and engaging in its own learning process. In Kuh & Nelson research, and in the present study, it is assumed like: How much the students get involved in true educational effective practices supported in ICT? 3 These educational effective practices, they are such like: Using the Internet to be connected with other students and for to find information, to send the professor an e-mail to clarify doubts on an assignment, to coordinate with classmates for telematics media a working party's activities, etc. 4 The notation 5 The notation b=.xx it is used for indicate "structural coefficients" that measures the effect of an independent variable (exogenous) over a dependent variable (endogenous). In programs for modeling SEM, like LISREL©, corresponds to the values deployed on the arrows in the proposed model's diagram. 6 Smaller values in the ECVI are indicatives of goodness fit in the model.
REFERENCES Arkin, & Colton. (1965). Tables for Statisticians. Fundamentals Statistics in Psychology an Education. Tokyo, Japan: McGraw Hill. Bates, A. W. (2001). Cómo gestionar el cambio tecnológico. Estrategias para los responsables de centros universitarios (1ra. ed.). Barcelona, España: Gedisa. Carnoy, M. (2004). Las TIC en la enseñanza: posibilidades y retos. Recuperated 15/11/04, from http://www.uoc.edu/inaugural04/dt/esp/carnoy1004.pdf Godoy, C. (2004). Usos y Penetración de Internet entre Estudiantes Universitarios venezolanos (El caso de los estudiantes universitarios barineses). Paper presented at the Edutec'2004, Barcelona, España. González Martínez, P. (1988). Indicadores sintéticos de rendimiento estudiantil. Recuperated 10/06/05, from http://iies.faces.ula.ve/Revista/Articulos/Revista_02/Pdf/Rev02Gonzalez.pdf Haywood, J., Haywood, D., Macleod, H., Baggetun, R., Harskamp, E., & Tenhonen, P. (2004). A Comparison of ICT Skills and Students Across Europe. Journal of eLiteracy, 1, 69-81. Hernández-Sampieri, R., Fernández-Collado, C., & Baptista-Lucio, P. (2003). Metodología de la Investigación (3ra. ed.). México, D.F.: McGraw Hill Interamericana Editores, S.A. Kerlinger, F. N., & Howard, B. L. (2002). Investigación del Comportamiento. Métodos de Investigación en Ciencias Sociales (4ta. ed.). México, D.F.: McGraw Hill Interamericana Editores, S.A. Kuh, G., & Nelson, T. (2004). Student Experiences with Information Technology and their Relationship to Other Aspects of Student Engagement. Paper presented at the Annual Meeting of the Association for Institutional Research, Boston, MA. Kuh, G., & Vesper, N. (1999). Do computers enhance or detract from student learning? Paper presented at the Annual Meeting of the American Educational Research Association, Montreal, Quebec. Medrano, J. D. (1992). Métodos de Análisis Causal. Madrid: Centro de Investigaciones Sociológicas. Pérez Díaz, V. (2006, marzo 18). ¡Estudiando papá!El Nacional, pp. A-16. Pew Internet & American Life Project. (2002). "The Internet Goes to College: how students are living in the future with today´s technology". Recuperated 15/01/03, from http://www.pewinternet.org/reports/toc.asp?Report=71 Russell, T. L. (1999). The no significant difference phenomenon. Raleigh, NC: North Carolina State University. Sancho Vinuesa, T., & Miralles Puig, L. (2004). Internet y la red de universidades catalanas. Barcelona, España: UOC-IN3. SEUSISS PROJECT. (2003). Survey of European Universities Skills in ICT of Students and Staff - Final Report. Recuperated 15/01/04, from http://www.intermedia.uib.no/seusiss/ SPOT PLUS. (2003). Students Perspective on Technology in Teaching and Learning in European Universities - Participation and Learning of University Students. Recuperated 15/04/04, from http://www.spotplus.odl.org/ TendenciasDigitales, & Cavecom-e. (2005). Indicadores de Penetración y Uso de Internet en Venezuela. Recuperated 09/12/05, from http://www.tendenciasdigitales.com.ve/td/documentos/Penetracion_Internet_Diciembre_2004.pdf Visauta-Vinacua, B., & Maritori-i-Cañas, J. C. (2003). Análisis Estadístico con SPSS para Windows. Volumen II: estadística multivariante (2da. ed.). Madrid: McGraw Hill Interamerica de España, S.A. Wenglinsky, H. (1998). Does it Compute? The Relationship Between Educational Technology and Student Achievement in Mathematics. Princeton, NJ: Policy Information Center. Educational Testing Service [ETS]. Wenglinsky, H. (2003). Using Large-Scale Research to Gauge the Impact of Instructional Practices on Student Reading Comprehension: An Exploratory Study. Education Policy Analysis Archives, 11(19).
Copyright for articles published in this journal is retained by the authors, with first publication rights granted to the journal. By virtue of their appearance in this open access journal, articles are free to use, with proper attribution, in educational and other non-commercial settings. Original article at: http://ijedict.dec.uwi.edu//viewarticle.php?id=215&layout=html
|
||||||||||||||||||||||||||||||||||||||||||||||||||||||||||||||||||||||||||||||||||||||||||||||||||||||||||||||||||||||||||||||||||||||||||
