Effects of integrating digital visual materials with textbook scans in the classroom
Saurabh Panjwani, Luana Micallef, Karl Fenech and Kentaro Toyama
Microsoft Research India Pvt. Ltd., Bangalore, India
ABSTRACT
This work examines the effects of treating learners in a classroom to digital visual materials on a shared display, while interleaving such materials with scanned copies of relevant textbook pages. Forty-six ninth-grade students in a public school in Bangalore (India) were divided into two groups and given instruction in Science and Literature, the first group (control) being exposed to digital visual materials in both classes while the second (treatment) to the same materials interspersed with digitally-scanned copies of textbook pages. Students in the treatment group outperformed those in the control group on tasks involving recall and recognition of the visual materials (although the gap was significant only for recall-based tasks). Our results suggest that digitized versions of textbooks are useful in improving students’ retention of visual materials utilized during classroom instruction.
Keywords: education; technology; visual materials; classroom; textbooks
INTRODUCTION
Visual learning materials can be quite effective in enriching the classroom experience for students by enabling them to observe situations and processes which are otherwise difficult to portray inside the classroom. There is extensive evidence in the literature to support the claim that the use of digital visual materials – either static images or video – in the instruction process can raise students’ attention levels and can also significantly improve their performance in retention and comprehension tasks (Hoban & Ormer, 1970; Katsioloudis, 2007). Such evidence exists across all grades of schooling (ranging from middle school all the way up to university education) and in almost all curricula, although science education seems to have received the greatest amount of research attention (Katsioloudis, 2007).
There is a general consensus among both researchers and practitioners that visual materials are effective in the classroom only when used as a supplement – and not as a substitute – to basic teaching tools like textbooks, blackboards and the teacher’s voice (Hoban & Ormer, 1970). However, the issue of how to use visual materials to play this supplemental role so as to maximize their pedagogical impact is still a subject of debate and research (Su, 2009). The issue is particularly pertinent for schools in developing regions, where such aids are just beginning to find their way into the classroom, while the standards of teaching in the schools remains below par.
In this paper, we examine one possible approach to supplement traditional classroom instruction with digital visual materials and study the effects of this approach on the classroom learning process. At a very high level, our approach involves presenting visual materials in the classroom while “interleaving” them with scanned digital copies of suitably-chosen textbook pages. The rationale behind using textbook pages with visual materials is quite simple: textbooks are an integral part of the teaching process in today’s classrooms and they are the most easily accessible learning materials for the students, both for learning new concepts in class and for recalling what has been learnt later on. By integrating visual materials with content drawn from textbooks, it becomes easy for the teacher to demonstrate relations between the two types of materials, thus placing the former within a familiar context for the students.
The actual “interleaving” between the visual materials and textbook pages in our approach takes place using a novel presentation tool which has been developed by our research group. This tool allows teachers to easily switch between visual materials and textbook scans, and also to perform simple operations like highlighting and enlargement of text, overlaying images on text, zooming in and out of pages, and digital inking. (More details on the tool are given in the succeeding section.)
While the idea of integrating visual materials with textbook pages in this manner may appear intuitively appealing, the learning impact it produces in a real classroom setting needs to be studied and understood before deploying it on scale. To this end, we tested the concept in a public school in India, and conducted a rigorous eight-day study involving two instructors and 46 ninth-grade students at the school. The main objective of our study was to understand whether or not the idea of interleaving visual materials with digitized textbook pages – as done by our presentation tool – could lead to changes in the students’ retention and comprehension of the instructional content. For this, we divided our test subjects into two well-balanced groups – a control group which was instructed using visual materials only, and a treatment group which was instructed using the same materials but interleaved with scanned digital copies of textbook pages.1 Lessons were delivered in two curricular subjects – Science and Kannada Literature (Kannada being the medium of instruction at the school where we conducted our study) – and the instructor and instructional content for each subject were fixed across both the groups. The instructors used the blackboard as well as our presentation tool for delivering the lessons, and freely interacted with the students during the classes. The specific questions we were interested in seeing answered were:
- How does the classroom behaviour of students in the control group compare with that of students in the treatment group? In particular, do the students use their personal textbook copies differently in the two groups?
- Does the treatment group perform better than the control group on questions designed to test either recall or comprehension of the verbal content?
- Do the groups differ in terms of retention of the visual content? In particular, does the treatment group perform better on questions designed to test recall and recognition of the visual content?
Overview of Our Results
The main findings from our study can be summarized as follows: First, in terms of recall and comprehension of verbal content delivered in the classroom, the groups performed at roughly the same level, with the difference in their performance being statistically insignificant in the case of Science as well as of Kannada. While this result does not provide any strong basis to favour our approach of integrating visuals in classroom instruction, it does give us some evidence that our approach is not detrimental for students’ learning. Second, and more importantly, we found that the treatment group did better than the control group in terms of retention of the visual content shown to them. Students in the treatment group were able to recall information associated with visual materials – in particular, pictures – that they had been shown in class with greater accuracy2 and they could also recognize these materials (e.g., given multiple pictures, identify the correct picture associated with a particular word) better than the control group. The performance gap between the two groups was statistically significant (p < 0.05) in the case of recall-based questions. In the case of recognition-based questions, the gap was not statistically significant although it was still quite noticeable (especially in the case of Science).
We interpret these findings in the context of previous work on educational psychology which demonstrates that retention of visual information in memory can be significantly improved by displaying such information along with relevant verbal information (Wiseman, MacLeod, & Lootsteen, 1985; Wogalter, Sojourner, & Brelsford, 1997). We remark here that although the question of how verbal content influences visual retention has been addressed in several research studies, such studies have been undertaken in very controlled environments where learning is not mediated by a human instructor. To the best of our knowledge, ours is the first work which explores this question in the context of a real classroom, while involving a human instructor to mediate in the learning process, and while using a specific classroom resource (students’ textbooks) as the source of all verbal information.
Besides students’ performance on visual recall tasks, we also observed some significant differences between the treatment and the control groups in the way they used the printed textbooks, both inside and outside class. In Science classes, more treatment group students tended to refer to their textbooks whereas in Kannada classes, more control group students tended to do so. Usage of textbooks even at home had the same pattern: for Science, more treatment group students reported to have read their textbooks at home whereas for Kannada, more control group students reported to have done so.
Scope of the Research
Although the research questions we investigate here are of fairly general relevance, we believe that our results have a greater bearing on education in developing regions than in other places. Schools in developing regions have only recently (in the last decade) begun to deploy digital technology, and in particular, various governments and non-profit organizations have aided such deployments with the hope that the new technology could help make up for the poor quality of teaching staff in the schools (Banerjee, Cole, Duflo, & Linden, 2007). Although we do not agree with such a motivation to use digital technology, we do believe that enabling technology to be effectively used by teachers in developing region schools is an important research problem, which has, thus far, remained unaddressed. The literature suggests that classroom instruction in schools in India is still heavily dependent on textbooks and that teachers are reluctant to use new technology if it does not enable them to deliver content which is aligned with the content of the textbooks (Aruna, 1999; Kingdon, 2007). Indeed, one of our motivations to build a tool that enables integration of visual materials with textbook pages was to facilitate the process of adopting technology (for teaching) by our target teachers. Our experience in the field indicates that this idea was, in general, well-received by the target teachers, which, along with other factors (e.g., simplicity of the tool itself), reduced the amount of effort required to train them to use the tool in the classroom.
Related Work
There is a huge body of literature which supports the assumption that the use of visual aids in the classroom enhances learning, not only by facilitating retention of information but also by promoting comprehension and transfer. (For a summary of past work in this area, see (Katsioloudis, 2007).) Although there is evidence to suggest that both static images and videos have a positive influence on learning, the jury is divided on the question of which of these modes of presenting visuals is more suited for classroom instruction. In fact, some recent studies argue that static visual materials (i.e., pictures or hand-drawn diagrams) can be just as effective for enhancing learning as are film and animation; in particular, for science instruction, multiple studies have shown that using animations in instructional materials provides no significant learning advantage over the use of static images alone (Stokes, 2001; Tversky, Morrison, & Betrancourt, 2002).
While the impact of visual materials on learning has been researched extensively, the issue of how to integrate such materials with verbal information during classroom instruction seems to have received relatively less attention. Studies in psychology have shown that displaying static images with relevant verbal information can significantly improve learners’ ability to recognize the images later on, and that the greatest improvement is achieved when the verbal information is displayed after the corresponding image (Wiseman, MacLeod, & Lootsteen, 1985; Wogalter, Sojourner, & Brelsford, 1997). However, such studies have been conducted in very controlled settings, without the presence of a human mediator in the learning process. In contrast, the study that we undertook involved the participation of an instructor, who not only displayed visual materials to the students (with or without the relevant verbal content), but also interacted with them, and used tools other than the digital display, such as the blackboard, to explain the content of the materials. Indeed, it is quite surprising that results similar to those of (Wiseman, MacLeod, & Lootsteen, 1985) could be reproduced in such a complex learning environment. We also note that the verbal content used in our study was created almost entirely by digitally scanning specific print materials – namely, the students’ textbooks – and that the students had the facility to freely access these materials outside the classroom and prior to being evaluated.
THE SETTING
The test-bed for our research was a public school situated in the rural suburbs of Bangalore (the capital of the state of Karnataka, India), about 40 km from the heart of the city. This school is administered by the Karnataka State Government and follows the state board (SSLC) curriculum, offering seven courses of study: Kannada (which is the main medium of instruction), Math, Science, Social Science, English (second language), Hindi (third language), and physical education. There are roughly 250 students enrolled across grades 1 through 10, with a majority (approximately 150 students) studying at the secondary level (grades 8 to 10).3 For each grade, there is exactly one class comprising all the students at that grade; as such, there are some classes with as many as 50 students. All students at the school come from an extremely poor socio-economic background, 80% of them belonging to families with an average daily income of less than $1 (which translates to roughly 50 Indian National Rupees (INR)) a day. School facilities – including textbooks, uniforms, and mid-day meals – are provided to them almost free of cost.4
The school has 11 teachers – four in the primary division, seven in the secondary division – but all our interactions during the study were with two particular secondary school teachers, one a teacher of Kannada, and the other of Science. These teachers come from very similar backgrounds, each of them holding a master’s degree in their respective areas of expertise from universities of similar standings. The Kannada teacher has had two years of teaching experience prior to our study while the Science teacher is relatively more experienced with five years behind him. In terms of familiarity with computers, the Science teacher is again more experienced (owns a PC and has Internet access at home), though in terms of proficiency in using computer tools like the keyboard and the mouse and elementary Microsoft Windows software5 (in particular, Microsoft Office applications), both teachers seemed to be at par (and better than the other teachers at the school). In fact, the Kannada teacher is proficient with one particular Kannada scripting tool – named Nudi6 – that we used to prepare class materials. Neither of the teachers had prior experience in using digital technology for classroom instruction.
The Presentation Tool
A critical component of our study was the presentation tool which the teachers used to present digital materials in their classes. This tool allows a user to augment textbook content with different types of digital media, and to present the integrated content in a whole-classroom setting. There are essentially two types of media that the tool supports – digital images and digital videos.7 The process of using the tool consists of two steps: Prior to class, the teacher collects all materials he/she needs and loads them into the tool – presumably being run on a laptop – in a suitable order. The images which the teacher loads could be obtained from any source, and, in particular, they could be obtained by scanning or photographing printed materials such as textbooks. After this step, the teacher takes his/her laptop to class, connects it to a display device (e.g., a projector), and conducts the class by presenting the materials he/she has collected. The materials are displayed in the order in which they were loaded, although it is possible for the teacher to switch between one material and another (for example, show a textbook scan, then show a video, then go back to the textbook scan).
While presenting materials through our tool, a teacher can perform certain operations to make the delivery of the materials more effective. Some of the key operations that our tool permits and that were consistently used during the study are (see Figures 1, 2a and 2b).
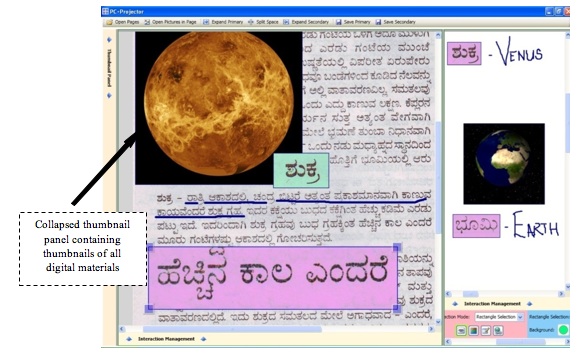
Figure 1: A screenshot of our presentation tool, illustrating some of the features it offers.
- Selection of rectangular regions: Rectangle-shaped regions within an image can be selected by defining two diagonally-opposite corners of the region using the mouse. The selected regions become independent elements which can be resized and moved around by dragging and whose background colour can be determined by the user. During the study, this feature was used by the teachers to highlight and enlarge key words and phrases from textbook pages, as shown in Figure 2a.
- Overlaying an image on another image: This feature was mainly used by the teachers to place a non-textbook image within a textbook page in order to relate it to content from the textbook. In Figure 2b, the image of Venus (which is not contained in the textbook) has been superimposed over a textbook page.
- Overlaying rectangular regions within an image: This feature was used to “label” images with text extracted from textbook content (as done in Figure 2b for planet Venus).
- Digital freeform inking: The tool allows users to write on top of images using a suitable input device (in our case, this was a graphics tablet with stylus attached to the laptop). The teachers at our school used this feature to underline text, and to elucidate the meanings of words and images in their own handwriting.
- Extracting and merging content from different images: Finally, it is also possible to extract rectangular regions from multiple pages and to assemble all these components in a single area, called the virtual whiteboard (shown Figure 2b). One can also include entire images in this area, and perform digital inking (as shown). This feature was consistently used by our teachers to merge phrases from the textbook with images and display them in the whiteboard.
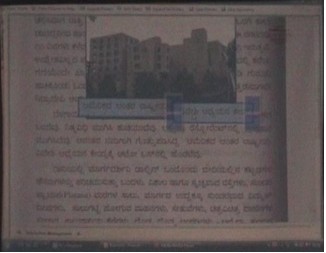
Figure 2a: Snapshot of our tool as it was used by teachers during the research study. The picture shows the rectangle selection feature being used by the teacher in a Kannada class.
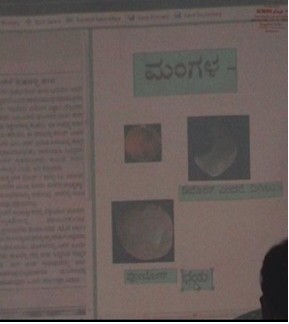
Figure 2b: Snapshot shows the Science teacher annotating the images of Mars and its two moons with their corresponding names in the virtual whiteboard.
We remark that some of the features in our presentation tool are offered by other presentation tools (like Microsoft PowerPoint, and its derivatives like Classroom Presenter (Anderson, et al., 2007)) as well, but there are a few which we found were missing in such tools. In particular, the ability to select and manipulate rectangular (or other) shaped regions from a textbook image and the ability to assemble content in a virtual whiteboard while doing the presentation could not be implemented in these tools. Indeed, it was with the purpose of providing these features to our teachers that we designed a presentation tool from scratch (rather than deploy a tool that was already in existence).
RESEARCH METHODOLOGY
Initial Field-testing
As a precursor to our formal study, we did extensive testing of our presentation tool for two months by having the teachers at the school use it while teaching their classes. This “testing” phase lasted from the first week of August 2008 up to the end of September 2008. During this phase, our research team would visit the school 1–3 times a week and on each visit, two classes would be conducted using our tool. The tool was most extensively used by the Kannada and Science teachers for classes from grades 7 through 10, with ninth grade receiving the maximum exposure to the tool. The preparation for each of these classes was done jointly by the teachers and the researchers: The teachers would make a rough class plan, decide upon which textbook pages to scan, and identify topics for which additional digital materials were required; the researchers would then collect the materials from various sources and, on their next visit, combine these materials with the textbook scans in an order decided by the teacher. Sometimes, the teacher would make his/her notes using the Kannada scripting tool, Nudi, and Microsoft PowerPoint; these notes would then be included (as images) in the set of class materials. The hardware used for presentation consisted of a laptop and a projector,8 both of which were provided by our team for the purpose of the study.
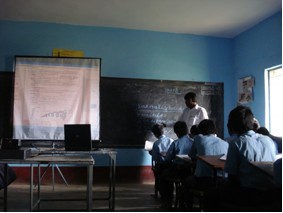
Figure 3: Science class being conducted during the field testing period. The science teacher preferred to use the blackboard to explain certain parts of the material and so we needed to switch between “blackboard” mode and “projector” mode of instruction regularly. Students sitting near the window were assigned the task to open and close windows as desired. Care was taken not to shut all windows in the “projector” mode.
The main objective of this exercise was to help the teachers become familiar with the presentation tool, and to elicit feedback from them on the features we had built. Indeed, the teachers’ feedback inspired or influenced various modifications to the tool – some new features were added (for example, the facility to overlay images was included during the testing phase), and some others which did not find favour with the teachers were removed. Textbook scans were used in almost all the classes, and the feedback we received from the teachers on their usage was, in general, quite positive. For example, the Science teacher, who was initially reluctant to use projections of textbook scans in class, eventually started using the scans to show diagrams (which he would otherwise have to draw on the blackboard), to select and emphasize important phrases from the textbook, and also to label supplementary visual materials with text extracted from the textbook.
Study Organization
As stated in the introduction, the subjects for our study were the 46 ninth-grade students at the school, and we chose Science and Kannada Literature as the curricular subjects for instruction. With the help of the teachers, we picked one chapter from each of the curricular subjects to be taught to the students. For Science, the chapter was “The Universe”; for Kannada, it was a short story titled “Paris: An Ocean of Art”. Based on recommendations from the teachers, we collected a number of digital images relevant to these chapters (32 images for Science, 129 for Kannada), and a few digital videos (5 for Science, 1 for Kannada). PowerPoint slides containing brief notes by the teachers (20 slides for Science, 15 for Kannada) were also prepared and converted to images. Finally, the textbook pages corresponding to the two chapters were scanned and included in the set of materials.
Next, we divided the 46 students into two equal-sized groups – a control group and a treatment group. The separation into control and treatment groups was identical for Kannada and Science; i.e., the control group for Science was also the control group for Kannada, and similarly for the treatment group. The division into groups was not randomized; it was manually performed while ensuring balance in terms of (a) past performance in class (which was estimated using the students’ grades in the eighth-grade final tests for both Kannada and Science) and (b) gender.9 Besides gender and grades, the groups were quite similar in terms of the family backgrounds of the students as well.10
The material to be taught to the students was divided into three portions for each curricular subject, with each portion meant to be covered in one class period. During the study, each period would be taught twice – once for the control group and once for the treatment group – but by the same instructor. (Thus, for each curricular subject, six classes would be taught in all.) We prepared a schedule for the classes ahead of time in a way so as to minimize “cross-group” influences; that is, if the control group was to receive period one for a particular curricular subject before the treatment group did so, the treatment group would be the first to receive period two for that subject. The seating arrangement for both the control classes and the treatment classes was fixed a priori and before fixing the positions, we ensured that each student in each group could read text shown on the projector screen from his/her assigned seat. (For this, a brief eye-test was conducted with both groups wherein students were asked to read text on the projector screen individually from their assigned position.)
The Study
The study ran over eight school days in the first two weeks of October 2008, with the first day being dedicated to a pre-test, the subsequent six days to classroom instruction, and the final day to a post-test. On each of the “instruction” days, two classes – one of Science followed by another of Kannada – were conducted. The start time for each of the Science classes was the same, and similarly for each of the Kannada classes. The durations differed but we ensured that, for each period for a given subject, the duration of both classes (one for control, one for treatment) was the same. Teachers used our presentation tool with the digital materials collected prior to the study, and the tool ran on the same hardware as was used during the field tests. The materials used were identical for both groups except for one key difference: the materials for the treatment group included scans of textbook pages whereas those for the control group did not.
The printed textbooks were also used during the classes, albeit differently for the two curricular subjects. For Science, the teacher used a personal copy of the textbook for reference in both control and treatment classes, but the students were not required to bring textbooks to class (although they were allowed to do so if they wished). The expectation was that they would make notes in their notebooks and use these, ideally alongside their textbooks, for later reference. For Kannada, however, things varied across control and treatment classes. In the control classes, students were required to get their own copy of the textbook to class and read out parts of the text from it aloud on a rotation basis. (This practice was also followed in the regular Kannada classes at the school.) In the treatment classes, students were required to, one-by-one, read aloud from the projected textbook scans shown to them by the teacher, but bringing a personal copy of the textbook was not required (although they were allowed to do so if they wished). Note-taking was left to the students’ discretion.
Besides the differences concerning the use of textbooks, we tried to keep the structure and organization of both types of classes identical. In particular, the order in which the class material was delivered was the same for both the control group and the treatment group, and teaching aids other than the digital technology, if used, were employed in the same manner and at the same juncture in class for both groups. The teachers ensured that the duration for which each visual material was shown to the students was roughly the same for both groups. The researchers were present in all the classes but their activities (which consisted of videotaping the class from the back of the room and taking observational notes) were the same throughout and did not interfere with the instruction process.
Measures of Learning
The statistic we used to measure the performance of each student was the difference between the student’s score on the pre-test (administered on the first day of the study) and that on the post-test (administered on the last day). The two tests contained exactly the same questions, but in different orders. For Science, the questions were designed jointly by the teacher and the researchers, while for Kannada, they were designed entirely by the teacher. For both subjects, most of the questions were designed to test recall and recognition, although there were some which also tested comprehension of the material.
In each test, there were some questions – 3 out of 18 in Kannada and 5 out of 13 in Science – which included printed versions of digital images that had been shown to the students in class. (The prints had the same colours as the digital versions.) We refer to these questions as picture-based questions. Picture-based questions were of two types: those that tested recall (e.g., “Identify the planet shown in the given picture.”) and those that tested recognition (e.g., “Which of the following four pictures illustrates Saturn?”, or “Which of the following four planets has the satellite shown in the given picture?”). In the Science test, there were 2 picture-based questions that tested recall and 3 picture-based questions that tested recognition. In the Kannada test, there were 4 picture-based questions which tested recognition, but none which tested recall.
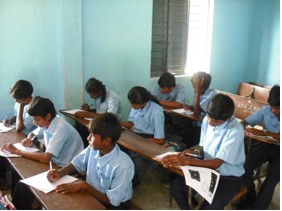
Figure 4: Students answering the post-test for Science. Notice that the question papers contain pictures corresponding to the picture-based questions. Coloured versions of the pictures were provided to the students as hand-outs on a shared basis.
RESULTS
Students’ Usage of Textbooks
The very first observation we made during the study was regarding the way students used their textbooks in response to the treatment. In both Science and Kannada classes, there was a noticeable difference between the treatment and the control groups in terms of how much they used their textbooks in class. In Science classes, for example, more students in the treatment group (36% on average) tended to use textbooks in class than the control group (20% on average). This behaviour was quite expected – the treatment group students were using their textbooks simply to relate to the projected textbook scans they were being shown by the teacher. (In fact, a few of the students even emulated the actions that the teacher performed on the textbook scans. For example, if the teacher highlighted a piece of text using our rectangle-selection feature, they would draw a rectangle around the same piece of text in their own textbooks!)
The behaviour of the students was different in the Kannada classes. Here, the fraction of students who used textbooks in class was greater for the control group than for the treatment group (93% for the former and 50% for the latter).11 One could attribute this to the fact that in Kannada classes, control group students were required to bring their textbooks to class and read from them, whereas in the treatment classes, students could simply read text from the projector screen. Still, not using the textbook at all was inconsistent with the behaviour of the students in regular Kannada classes (without the digital technology) where they always bring and read from their textbooks.
We also found that the usage of textbooks by students at home had the same pattern as their usage in class: for Science, more treatment group students reported to be reading their textbooks at home during the study period, as compared to the control group students (93% versus 61%) whereas for Kannada, it was just the opposite – the number of control group students who said they read textbooks at home was greater (88% versus 72% for treatment). (However, for Kannada, the gap between the control and treatment groups is less pronounced here than the gap for in-class usage of textbooks.)
Effects on Learning Outcomes
Two students – one from the control group and one from the treatment group – were absent for some of the classes during the study;subsequently, data derived from their scores on the tests was excluded from our analysis. We used the student’s t-test12 to perform comparisons between the performance of the treatment group and that of the control group. All p-values were computed using Microsoft Excel.
As a first step, we compared the two groups in terms of their overall performance (difference between post-test score and pre-test score) in both Science and Kannada. No significant differences were observed in either of the cases, and both groups seemed to have fared at the same level in both the curricular subjects. (In particular, in Science, the average performance of the control and treatment group students was 46.6% and 45.6% respectively, whereas that in Kannada was 31.2% and 33.7% respectively. The difference in performance was statistically insignificant in both cases.)
We then compared the groups in terms of their performance only on the picture-based questions in the two tests (performance, again, measured as the difference between post-test and pre-test scores). Here, we noticed a significant gap between the two groups, with the treatment group performing better than the control group in all the picture-based questions. In particular, in the Science test, the treatment group’s average performance on the picture-based questions was 46% whereas that of the control group was only 34%. In terms of students’ performance in recall and recognition tasks, our observations were as follows:
- On the two recall questions in the Science test, average performance of the treatment group was 61.4% and that of the control group 36.4%. The gap between the two measures is significant, t(41) = 1.9171, p < 0.05.
- On the three recognition questions in the Science test, average performance of the treatment group was 43.9% and that of the control group 30.3%. The gap in this case approaches significance, t(41) = 1.4126, p < 0.10.
- On the four recognition questions in the Kannada test, average performance of the treatment group was 25%, while that of the control group was 23.9%. The gap in this case was not significant.13
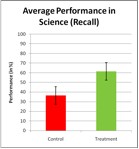
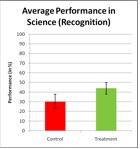
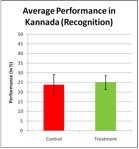
Figure 5. Bar graphs illustrating the average performance (difference between post-test and pre-test scores) of the two groups on picture-based questions. The error bars represent standard error of the mean (SEM). The gap between the two groups is statistically significant for questions that tested recall of information.
It is quite plausible that our treatment had induced these performance gaps between the two groups.The pictures that students were shown during the study were conceivably, unfamiliar to most of them, and while the control group students saw these pictures without any accompanying digital materials, the treatment group students witnessed them spatially interleaved with scans of textbooks of which they themselves possessed a copy. In the treatment classes, the teacher consistently overlaid pictures over the textbook scans and used text from the scans to label the pictures, too. (In particular, this was true for all the pictures on which questions were based in the post-test.) The visual interspersion between the pictures and the textbook scans could have enabled the treatment group students to form mental associations between the two media – text and pictures – which students from the control group could not form. Furthermore, the pictures – or at least the event that they were displayed in class – might have been recalled by the students when they revisited their textbooks at home (as most in the treatment group reportedly did), and this could have helped the students retain them in memory for a longer duration (as compared to the control group students).
While treatment group students fared better in picture-based questions, they were worse off in the questions which did not contain pictures (that is, questions which tested their retention and comprehension of verbal information presented in the classroom). Specifically, their average performance was 39% on these questions while that of the control group was 47%. However, we found the difference in performances not to be statistically significant (P > 0.2). (Given this, it may appear confusing that the performance difference in picture-based questions was significant while the overall performance difference was not. The reason for this is that the number of picture-based questions on the tests was fewer than the number of non-picture-based ones.) We also observed some differences in performance based on gender – males in the treatment group did much better than those in the control group, and females in the control group did much better than those in the treatment group – but even these differences were statistically insignificant.
DISCUSSION
There are two inferences we are inclined to draw from the results of our study. The first one is that exposing students to digital textbook scans along with other digital materials influences usage patterns of the printed (paper) textbooks, both in the classroom and at home, and the influence could be quite different across curricular subjects. In particular, it could lead to an increase in the number of students who use the printed textbooks in a curricular subject (e.g., Science) where textbooks are not normally used, and a decrease in the number of students who use them in a curricular subject (e.g., Kannada) where they are normally used.
The second inference is that if, while displaying digital images (and possibly other information) to students in a classroom, the instructor also interleaves the images with digital copies of relevant textbook scans, then the result is an improvement in the ability to recall and recognize the images later on. As already mentioned, one explanation for this would be that thetextbook scans help students build associations between the digital images and the textbook material and, consequently, students (having easy access to textbooks outside class) can retain more information about the images than they would without seeing the textbook scans. It has been shown – in very controlled settings – that the use of textual materials can improve performance on picture recognition tasks (Wiseman, MacLeod, & Lootsteen, 1985); our result suggests that this may even hold in a less regulated environment like that of a classroom, where the textual and visual materials are used during instruction and in combination with various other teaching tools, and where there is a human instructor who mediates the learning process.
We believe that having the textual information derived from the textbooks helped improve retention of the visual content: the students in the treatment group could access textbooks at home and use them to recall the events that took place in the class (which, in particular, included the display of pictures along with the textbook content). The control group of students, even though they had easy access to textbooks at home, could not use them for visual recall since the textbook content was not utilized by the instructor while presenting visual materials in the classes.
CONCLUSION
Digital visual materials are useful to increase students’ attention levels in the classroom, and they often lead to an improvement in students’ comprehension of the class content as well. However, such materials – being usually a complex and unfamiliar form of stimulus – can be difficult for students to retain in memory. If the instructor’s goal is to help students not only understand the class content but also to retain the content they understand, lessons need to be designed with greater care. Our research suggests that one plausible approach to increase retention of visual content in the students’ memories is to interleave such content with relevant verbalcontent extracted from the students’ textbooks. While we do not advocate displaying scanned copies of textbooks in the classroom per se, we do believe that there is value in integrating such materials with supplementary visual content provided by the instructor, not only because this puts the latter in a more familiar context for the students, but also because it could potentially help students retain the visual content better (as indicated by the results of our study).
That said, it is hard to make a conclusive case for mingling textbook scans with visual materials in the classroom from the current study alone. We view our results as preliminary evidence in support of the hypothesis that textbook scans improve retention of visual content in classroom instruction, and to build greater faith in the hypothesis, a more extensive study with more participants situated in diverse learning environments needs to be carried out. Besides, it is desirable to reduce the complexity of the classroom instruction model and perhaps eliminate some variables which are not required to study this particular hypothesis (e.g., if the focus is only on pictures and textbook pages, then the use of PowerPoint slides and digital videos could be avoided altogether).
One important question that still remains unanswered from this study is the impact that our overall system has on learning and, in particular, how learning outcomes of students vary between a class that uses no digital technology at all, and another that uses it in every possible manner allowed by our presentation tool. Based on discussions with the teachers at our test school, and a survey of the students’ past performance and performance on the post-test administered during the study, our belief is that students are not performing significantly better with the introduction of our technology in the classroom. However, this belief needs to be validated (or invalidated) with rigorous research. We also believe that a presentation technology alone is unlikely to produce large differences in learning outcomes and, in order to influence the students’ learning better, we perhaps need to use technologies that engage students in a more direct manner. Good candidates for such technologies would be audience response systems (Caldwell, 2007) or shared display groupware (Stewart, Bederson, & Druin, 1999) – technologies that help students to collectively interact with the shared display in the classroom. However, the pedagogical impact of such technologies – especially in the context of primary and secondary education – has still not been understood well enough, and there is a dire need for more rigorous and long-term studies in this space.
ENDNOTES
1 The digital materials also included digital versions of some notes made by the teachers, but this was held constant across both groups. Students in both groups were permitted to use individual copies of the printed textbooks.
2 Technically, the task of identifying a given picture which has been previously viewed (along with its identity) is a type of “cued” recall task (Weiner, Freedheim, Schinka, & Velicer, 2003). However, we ignore such classification in this paper since no other type of recall (with respect to the pictures) was tested in our study.
3 In the public school system of India, schools offering classes at the primary level far outnumber those offering classes at the secondary level (the ratio of primary to secondary schools being at least 5:1 in some regions); as such, secondary schools typically have greater student populations.
4 There is a nominal annual fee (160 INR, which is roughly $4) charged to students at each grade in the secondary level; the fee is waived for girls and for students from families belonging to scheduled castes and scheduled tribes.
5 All software applications used during the study were run on Microsoft Windows.
6 Nudi is owned by the Government of Karnataka, and is freely available for download at http://www.ksphc.org/downloads.htm.
7 For the study, the version of the tool that we used did not incorporate digital video (although subsequent versions supported such functionality). However, digital videos were still shown to the students using a standard digital media player.
8 For most of the classes in the testing period (and for all of them in the study period), we used the Samsung P300 Pocket Imager as our shared display device. This decision was based mainly on the compactness of this projector and its ability to be powered by a battery for up to two hours. (Power supply was erratic in the school we were working with.) The projection was made on a screen with dimensions roughly 150 cm by 150 cm, which was adequate for a class with 23 students.
9 We used a very simple algorithm to perform the split. We first tried to ensure – to the extent possible – that for any grade (ranging from A+ down to C) and for any curricular subject (Science/Kannada), the number of students in the treatment group who received that grade in the eighth-grade exam was the same as that for the control group, and that genders were balanced out. Next, we minimized the difference between the total grade points for control and total grade points for treatment. Our control group had 10 males and 13 females, while the treatment group had 11 males and 12 females. The difference between the average grade points of the two groups was below 1% in each subject.
10 The average family size for the control (resp. treatment) group students was 5.5 (resp. 6.2), the average annual family income was $93 (resp. $83), percentage of students with working fathers was 87% (resp. 78%) – out of which 80% (resp. 83%) were landless farmers working on borrowed land holdings – and percentage of students with working mothers was 61% (resp. 70%).
11 In general, these percentages are much higher for Kannada than for Science since Kannada classes normally rely more on textbooks than those for Science. In fact, in their regular Science classes, students do not bring their textbooks to class at all, and make notes based on the instruction.
12 The Student’s t-test is a commonly-used statistical test for estimating the probability that the means of two sets of values (each assumed to be normally-distributed) are equal or not. See http://www.socialresearchmethods.net/kb/stat_t.php for a quick reference.
We believe that the smaller performance gap in this case could have been due to the nature of materials used in the Kannada classes: the total number of images students got exposed to was very large (129 pictures vs. 32 in Science) and the corresponding amount of text very little (5 textbook pages vs. 13 in Science).
REFERENCES
Anderson, R., Anderson, R., Davis, P., Linnell, N., Prince, C., Razmov, V., et al. (2007). Classroom Presenter: Enhancing Interactive Education with Digital Ink. IEEE Computer , 56–61.
Aruna, R. (1999). ‘Learn Thoroughly’: Primary Schooling in Tamil Nadu. Economic and Political Weekly, Volume 34, Number 18, 1011–1014.
Banerjee, A. V., Cole, S., Duflo, E., & Linden, L. (August 2007). Remedying Education: Evidence from Two Randomized Experiments in India. Quarterly Journal of Economics, Volume 122, Issue 3, 1235–1264.
Caldwell, J. E. (2007). Clickers in the Large Classroom: Current Research and Best-Practice Tips. CBE Life Sciences Education, Volume 6, Issue 1, 9–20.
Hoban, C. F., & Ormer, E. B. (1970). Instructional Film Research 1918–1950. Ayer Publishing.
Katsioloudis, P. J. (2007). Identification of Quality Indicators of Visual-Based Learning Material in Technology Education Programs for Grades 7–12. PhD Thesis. North Carolina State University.
Kingdon, G. G. (2007). The Progress of School Education in India. Oxford Review of Economic Policy (Issue: India), Volume 23, Number 2, 168—195.
McClusky, H. Y. (1924). An Analytical Study of the Content of Educational Motion Picture Films. In P.M. Freeman (Ed.), Visual education. Chicago: University of Chicago Press.
Stewart, J., Bederson, B. B., & Druin, A. (1999). Single display groupware: a model for copresent collaboration. ACM CHI Conference on Human Factors in Computing Systems (pp. 286–293). ACM Press.
Stokes, S. (2001). Visual Literacy in Teaching and Learning: A Literature Perspective. Electronic Journal for the Integration of Technology in Education, Volume 1, Issue 1, 10–19.
Su, B. (2009). Effective Technology Integration: Old Topic, New Thoughts. International Journal of Education and Development using ICT, Volume 5, Issue 2, Available online at: http://ijedict.dec.uwi.edu/viewarticle.php?id=620.
Tversky, B., Morrison, J. B., & Betrancourt, M. (2002). Animation: Can it Facilitate? International Journal on Human-Computer Studies, Volume 57, 247–262.
Weiner, I. B., Freedheim, D. K., Schinka, J. A., & Velicer, W. F. (2003). Handbook of Psychology. John Wiley and Sons.
Wise, H. A. (1939). Motion Pictures as an Aid in Teaching American History. London: Oxford University Press.
Wiseman, S., MacLeod, C. M., & Lootsteen, P. J. (1985). Picture Recognition Improves with Subsequent Verbal Information. Journal of Experimental Psychology: Learning, Memory and Cognition, Volume 11, Issue 3, 588–595.
Wogalter, M. S., Sojourner, R. J., & Brelsford, J. W. (1997). Comprehension and Retention of Safety Pictorials. Ergonomics, Volume 40, Issue 5, 531–542.
Copyright for articles published in this journal is retained by the authors, with first publication rights granted to the journal.
By virtue of their appearance in this open access journal, articles are free to use, with proper attribution, in educational and other non-commercial settings.
|