eSagu1: An IT based personalized agricultural extension system prototype – analysis of 51 Farmers' case studies
B. V. Ratnam, P. Krishna Reddy and G. S. Reddy
International Institute of Information Technology (IIIT), India
ABSTRACT
To bridge the information gap between the agricultural expert and the farmer, International Institute of Information Technology (IIIT), Hyderabad has built the eSagu ("Sagu" means cultivation in Telugu language) system, which is an IT-based personalized agricultural extension system to improve agricultural productivity by disseminating a fresh expert agricultural advice to the farmers, both in a timely and personalized manner. In e-Sagu, the agricultural experts generate the expert advice based on the information about the crop situation received in the form of both text and digital photographs. In Kharif2 2004, a prototype was developed and implemented with 1051 farms. In the prototype, a team of agricultural experts stayed at IIIT, Hyderabad (India) and delivered 20,000 pieces of agricultural expert advice to 1051 cotton farms of three villages (Oorugonda, Gudeppad and Oglapur) in Atmakur Mandal of Warangal district in Andhra Pradesh state, India, by looking at digital photographs and other farm information supplied by some educated and experienced farmers (coordinators) in these villages. The pilot project was implemented successfully. In this article, an analysis of 51 registered farmers' regarding compliance of advices and corresponding effect is reported. The following of expert advice on pest and disease management and IPM practices were analyzed by giving appropriate scores based on their effect on yield and input cost. The analysis showed that about fifty percent of farmers have followed the practices which increase yield and reduce input cost. A high positive correlation (r=0.46**) was observed between the compliance rate and the yields. Though some farmers obtained same yield as the farmers who have followed the advices, their input costs were significantly higher.
Keywords: eSagu; ICT; human capital; T&V System; knowledge system; information system; factor analysis.
INTRODUCTION
Indian farming community is facing a multitude of problems to maximize crop productivity. In spite of successful research on new agricultural practices, the majority of farmers is not getting upper-bound yield due to several reasons. One of the reasons is that expert/scientific advice regarding crop cultivation is not reaching farming community in a timely manner. It is true that India possesses a valuable agricultural knowledge and expert advice. However, a wide information gap exists between the research level and practice. Indian farmers need timely expert advice to make them more productive and competitive.
To bridge the information gap between the agricultural expert and the farmer, International Institute of Information Technology (IIIT), Hyderabad (http://www.iiit.ac.in) has built the eSagu ("Sagu" means cultivation in Telugu language) system (http://www.esagu.in), which is an IT-based personalized agricultural extension system to improve agricultural productivity by disseminating a fresh expert agricultural advice to the farmers, both in a timely and personalized manner (Reddy and Ankaiah, 2005, Reddy et al.2004). In e-Sagu, the agricultural experts generate the expert advice based on the information about the crop situation received in the form of both text and digital photographs. These photographs are sent by some educated and experienced farmers in the village. In 2004, a prototype of 1051 cotton farms was developed and implemented. In the prototype, a team of agricultural experts has stayed at IIIT, Hyderabad (India) and delivered 20,000 pieces of agricultural expert advice to 1051 cotton farms of three villages (Oorugonda, Gudeppad and Oglapur) in Atmakur Mandal of Warangal, in Andhra Pradesh State, India, by looking at digital photographs and other farm information supplied by some educated and experienced farmers (coordinators) in these villages. The project was successfully implemented (Reddy et al. October 2005, Reddy et al, December 2005).
The eSagu System and its operation
In eSagu, instead of agricultural expert visiting the crop, the crop situation is brought to the agricultural expert using both text and digital photographs. In eSagu the agricultural expert delivers the expert advice by getting the crop status in the form of digital photographs and other information rather than visiting the crop in person. In Figure 1, eSagu components are shown. eSagu contains five parts: (i) Farms, (ii) Coordinators, (iii) Agricultural experts, (iv) Agricultural Information System and (v) Communication System. The system operates in the following manner (Figure 2). Several farms are assigned to each coordinator (an educated farmer in the village). The farmer of the corresponding farm registers into the system by supplying the relevant information including soil data, water resources, and capital availability through coordinator. The coordinator visits the farm on a weekly basis and sends the crop details in the form of text and digital photographs and feedback of previous week's advice through communication system (Internet or courier). By accessing the soil data, farmer's details, crop database, and the information sent by the coordinators, the agricultural experts prepare the advice. The advice contains the steps that are to be taken up by the farmer to improve crop productivity. English is the main language. The agricultural experts prepare the advice and store it in the system. The coordinators get the advice by accessing the system through Internet. The coordinator then explains the advice to the farmer gets the feedback and sends it to agricultural expert. All the information is maintained in agricultural information system which can be accessed through Internet.
Some of the advantages of the system over existing traditional system of extension are availability of a team of diversified experts at a single place, conservation of time, money and energy , enabling correct diagnosis of the problem, strong database to support decision-making, zooming facility adds an extra dimension, accountability to the farmer, capacitating of rural livelihoods and employment generation, documentation of success stories and content development, feedback helps to evaluate and improve the performance etc.
We now explain the components of the software system. Each farmer receives unique identifier (Figure 3). The farmers' background and the soil details are collected and stored in the system. For each farm, the history is also maintained (Figure 4). The history of the farm is a sequence of advices received by that farm and corresponding observation photographs. Figure 5 shows the case of crop observation photographs sent by the coordinator for one farm. Figure 6 shows the photographs of a filled-in feedback farm. Figure 7 shows an advice prepared by the agricultural expert.
The results show that it is possible for the agriculture experts to deliver the advice by seeing the crop information in the form of digital photographs and text information. The agricultural expert can more effectively deliver the expert advice as compared to the advice provided by visiting the crop in person. Because, in the proposed system several agricultural experts discuss the problem and prepare the appropriate advice. Also, the expert advice has helped the farmers to improve input efficiency by encouraging Integrated Pest Management (IPM) methods, judicious use of pesticides and fertilizers.
The system has worked during the Kharif 2004. Each farm has received expert advice once in a week. In this article, evaluation has been made to see the compliance rate by analyzing 51 registered farmers. Other aspects like e-sagu analysis, results evaluation, farmers' responses were included in the file attached as a supporting document entitled "The Application of ICT in Indian Agriculture – The case of eSagu Model of Web-based Agricultural Expert Advice Dissemination System".
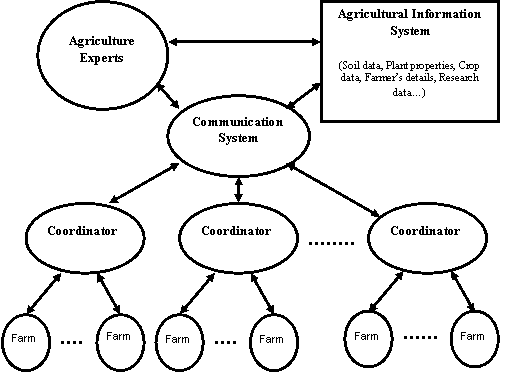
Figure 1. Components of eSagu system. In this, a double arrow indicates information flow.
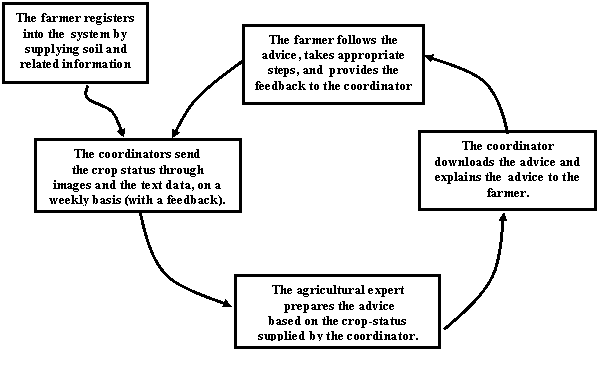
Figure 2. Depiction of eSagu operation
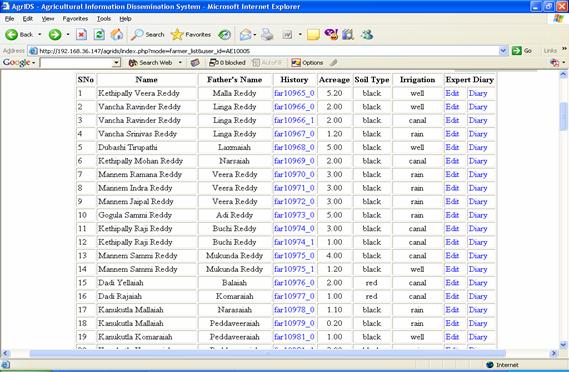
Figure 3: List of farms (farmers)
For each farm, the details such as the farmer's name, father's name, farm identifier, size of the farm (in acres), type of soil and water source are maintained. By clicking farm-id corresponding history is displayed.
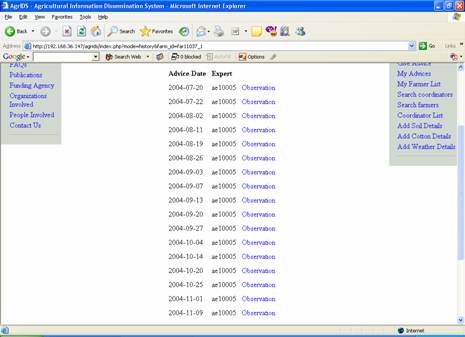
Figure 4: Farm history for one farm. By clicking "observation" corresponding photographs and advice is displayed.
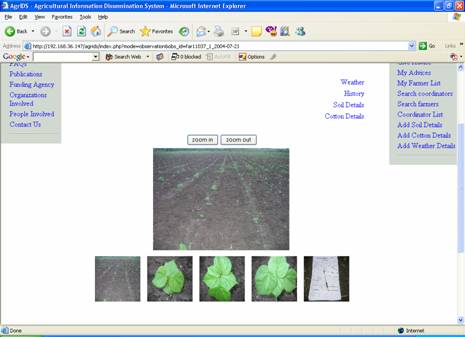
Figure 5: One instance of crop observation photographs. It contains four crop photographs and the photograph of crop observation (feedback) form. Each photograph can be zoomed.
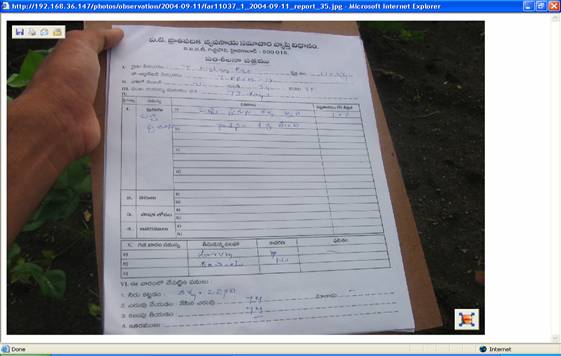
Figure 6: Zoomed photograph of crop observation sheet. The details of pest, disease, deficiency levels, and the result of last week's advice is written by coordinator in Telugu language.
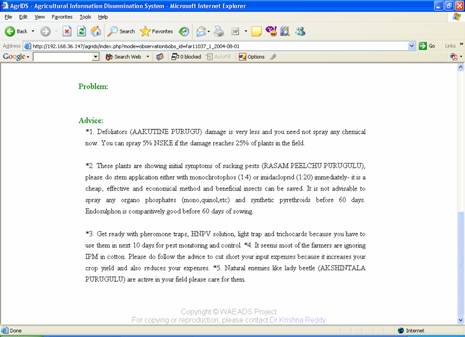
Figure 7: A sample advice prepared by agricultural expert based on the crop observation photographs, feedback form and soil details.
METHODOLOGY
Fifty one registered farmers of the project were taken to study their compliance rate on the advice delivered by the system. Compliance rate was seen for the farmers from their field observation sheet which was stored in the individual farm history. The project has the advantage of having farm history which includes the advice delivered and and corresponding feedback regarding steps taken. While evaluating the rate of follow-up some scores have been developed to see the rate of compliance and to make comparison between the farmers. As the cotton crop is pest prone, importance was given to insects and diseases management by making other factors like climatic and management aspects as constant. As the advice delivered has given to the area under the same geographical location there was less influence of rainfall and temperature on the follow-up studies. The management aspects like irrigation, weeding, fertilizer application and other inter-cultivation operations are not much varied among the studied farmers. So by making these factors uniform, the following of expert advice regarding management of major pests like American bollworm, spotted bollworm, sucking pests and grey mildew disease were taken as factors for analysis. It was observed that these factors had an influence on the yield and input to the farms. Farmers' data were taken as per their identifiers from the farm history for the whole cropping season.
Scores were allocated for each practice advised for specific pests, diseases and also their influence on the yield. Scores were also allocated to capture the degree of the advice follow-up. Any insect or disease which has a direct influence on the yield was given prime importance in giving scores.
Two kinds of scores were assigned: positive scores and negative scores. The factors which increase yield and decrease input cost were given positive scores and the factors which decrease yield and increase input cost were given negative scores.
Postive factors:
The factors include here are advice followed in control of helicoverpa, sucking pests, grey mildew, pink bollworm, and the number of sprays saved.
a) Helicoverpa control: One point was given for the each practice (either through organic or inorganic) to control helicoverpa. For example, if the farmer follows three pieces of advice for the helicoverpa control, he/she will get 3 points out of 5 (maximum value=5).
b)Sucking pests control: This year the effect of sucking pets on cotton crop was less in the project area. So, one point has been given for two pieces of advice followed to control the sucking pests.
c) Grey mildew control: During Kharif 2004, grey-mildew disease had an influence on the yield levels for most of the farmers. Maximum value for this factor is 4.
d) Sprays saved: This is the important factor in saving the money of the farmer. During the analysis it was observed the farmers have carried out several unnecessary sprays. So positive score is given for the factor "sprays saved".
The factor "Sprays saved" means the number of sprays that were not taken by the farmer, when expert advise mentions that the crop was fine. Otherwise the farmer would have gone for unnecessary spray. As this factor will have direct influence on the amount spent and maintaining eco-friendly ambience, maximum of 5 points have been allotted to this factor.
Negative factors:
The factors which decrease yield/increase input cost are considered as negative factors: These factors include, no sprays when required, unnecessary sprays, using high cost chemical in place of low cost one and repetition of same chemical.
a) Not spraying when required: This factor has due importance as it carries direct bearing on yield loss. This is the factor where farmer has not taken up spraying (either chemical or non chemical spray) when the expert has advised to do so. Maximum of five points have been allotted for this factor.
b) Unnecessary sprays: Unnecessary sprays means sprayings taken out by the farmer without need. Case studies of individual selected farmers show that, all the farmers without exception made many unnecessary sprays. These include three types of wastage
- Low cost chemical sprays (LC): Include chemicals which cost up to Rs. 750/ha like monocrotophos, quinolphos, chloripyriphos, imadachloprid etc.
- Medium cost chemical sprays (MC): Includes chemicals which cost up to Rs 1500/ha.
- High cost chemical sprays (HC): Includes chemicals which cost up to Rs 2500/ha.
Negative marks, minimum one point and maximum 5 points, were assigned to this factor.
c) Using high cost chemical in place of low cost one: This includes advice which emphasizes to spray organic or low active ingredient chemicals for the pest control in cotton. For example when the expert advised to go for NSKE (Neem Seed Kernal Extract) for the control of helicoverpa eggs and first instars, many farmers have gone for tracer spray. In our case studies, often it was observed that farmers always prefer high cost chemicals to spray for their fields, which was not at all necessary. One score point has been given for each high cost chemical sprayed where the insect control can be taken care of by low cost chemicals.
d) Repetition of the same chemical: Repeated use of the same chemical is continuously for 2 to 3 weeks has been observed. Insecticides like indoxicarb + acetamiprid and spinosad were mostly used for this type of activity by several farmers. For each repeated spray one point was allotted.
Above factors like unnecessary sprays, using high cost chemicals and repetition of the same chemical bears negative impacts for both the soil and the environment. They do increase pest resistance and pest resurgence.
RESULTS AND DISCUSSION
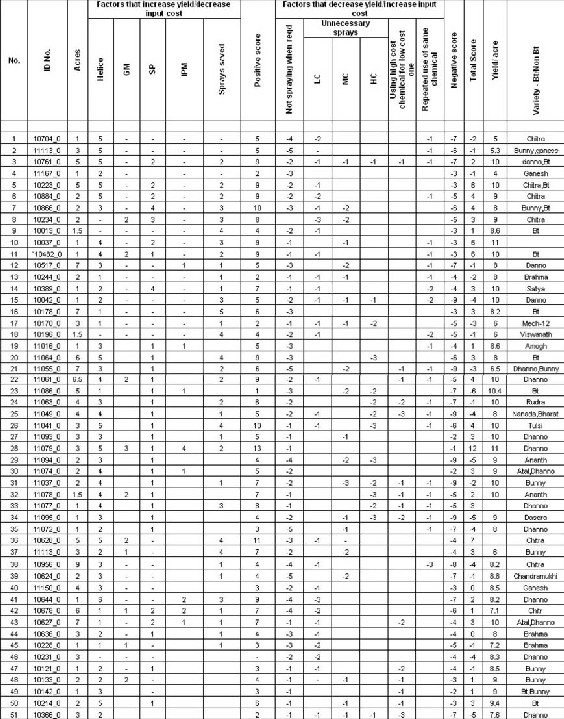
A total of 51 case studies have been carried out to see the impact of advice indicated by scores and yield. Table 1 shows the positive and negative scores of different factors of all the studied farmers. The analysis for each factor is as follows.
Table 1: Details of factors and scores for 51 farmers
(Click to enlarge in a separate window)
Analysis of Factors
a) Helicoverpa control: As Helicoverpa is the major pest of cotton in this area, all the farmers have followed the expert advice for the timely and effective control of this pest. The scores assigned ranges from 1 to 5 indicate there were farmers who have taken up the control as per the expert advice.
b) Grey mildew control: Only twenty percent of the farmers have followed the expert advice for the control of grey mildew disease. This is mainly because there was notion among the farmers that spraying wet-able sulphur as per the advice for the control of mildew there would be flower drop in the cotton. So it has become very difficult to convince them to spray to control the same.
c) Sucking pests control: Sixty percent of the farmers followed the expert advice delivered on sucking pests. The score 1 for many farmers in this factor indicates that least importance was given to control this type of pests as per the advise delivered.
d) Integrated Pest management: The advice delivered in the project mainly emphasized the importance of IPM, even though only 10 percent of the farmers were involved in this activity for pest control. We observed that farmers are not aware of the importance of this factor in protecting the soil and environment.
e) Sprays saved: The project has successfully helped the farmers in saving the sprays when the crop was fine. The analysis shows that 70 percent of them were not taken up spraying when the expert advised crop was fine. It was found that 30 percent of the farmers have followed spraying activities irrespective of the advice and pest threshold levels indicating that there were many unnecessary sprays carried out by the farmers. Though 70 percent of the farmers saved sprays, scores (1 to 4) indicate only one or two sprays have been saved as per the advice. However, it can be observed that eSagu was successful in saving the unnecessary pesticide sprays. On an average 1.5 sprays have been saved under this project.
f) Not spraying when advised: The data set shows that all the farmers under case studies have not taken up some of the spraying activities when advised to do so. Our experiences with the farming community indicates that there were many reasons for this factor like poor economic condition of the farmer, due to lack of confidence on the delivered IT based advise, illiteracy, casual approach and attitude of the farmer etc.
g) Unnecessary sprays: It was observed that the farmers have taken up the unnecessary spays for the cotton crop irrespective of farm size. Ninety percent of the farmers have sprayed low cost chemicals unnecessarily more than once. Forty percent of farmers unnecessarily sprayed medium and high cost chemicals. The reasons include the lack of awareness on pest threshold levels, superficial knowledge of the farmers, dependence on neighborhood farmers etc.
h) High cost chemicals: The analysis shows that along with unnecessary sprays, farmers have got inclined towards the use of high cost chemicals like spinosad, thiometaxam etc, instead of low cost pesticides advised. Thirty percent of the studied farmers have showed this type of activity.
i) Repeated use of same chemical: Fifty percent of the studied farmers came under this category. We recorded indoxacarb as the main chemical comes under this category. Most of the farmers were unaware of the ill-effects like pest resurgence, secondary infestation etc. due to repeated use of the same chemicals.
Analysis of Scores
Positive scores: The scores of yield enhancing/input reducing factors according to the compliance status are the representative positive score factors of the given farmer.
Total negative scores: The total scores gained by adding all the scores of yield reducing /input cost enhancing factors according to the compliance status is the representative negative score of the given farmer.
Total score: Total score is the score obtained by combining both positive and negative scores.
Farmers with total positive scores:
Table 1 shows that out of 51 farmers studied, 53% of the farmers got positive scores. This indicates that 53% of the farmers have taken up measures to control pests and diseases/lessen the input cost. Farmers with positive scores are the measure of compliance of the factors that increase yield /decrease input cost. This does not mean that they have high compliance rate. This indicates that these farmers have followed necessary sprays to control helicoverpa, grey mildew, sucking pest as per the advice. These farmers have less negative scores than positive, i.e., they seldom taken up the practices which lessen the yield /increase the cost of input.
Farmers with total negative scores:
Lower scores less than zero indicates that these farmers have not followed the expert advice fully and taken-up the activities which decrease the yield and increase the input cost. These farmers have carried out unnecessary sprays, used repeated sprays and also not followed necessary expert's advice. Nearly 47% of the farmers are coming under this category (Table1). Some of the reasons for not following the delivered expert advice were farmers' egoistic nature, superficial knowledge of the farmers, lack of education to understand the scientific farming, dependence on the neighborhood farmers and pesticide dealers etc.
Scores and Yield:
It was observed that many farmers who got the total positive scores have also recorded higher yields. Scores may not represent the exact yield levels but have influence on them. There was a significant positive correlation was observed between the compliance rate and yields (r= 0.46**) and also between scores and yields (r= 0.40*) (Table 2).
Less scores and High yields:
Many farmers (approx 20%) in spite of having negative scores have also recorded higher yields. Farmers under this category though got higher yields but the input costs were much higher than the positive score farmers with same yields. So it can be concluded that a farmer with 10q/ac yield with a score 6 (far 10223_0) has spent much less input cost than the farmer with same 10q/ac yield with -4 score (far 10042_0) (Table 1)
Compliance rate and scores
It was observed that there was a positive correlation exists between compliance rate and scores(r= 0.57**). Majority of the farmers who have got >10q/ac yield, recorded a compliance rate ranging from 40 to 75 %.
The study indicates that advise delivery has some influence on the higher scores development. It has observed that inspite of giving weekly advice for crop management we have recorded almost 50% of the farmers have negative scores. This factor needs further studies.
Table 2: Scores and Compliance Rate
No |
Percentage of Advice Followed |
Scores |
Yield
(quintals/acre) |
1 |
50.0 |
6 |
10.0 |
2 |
50.0 |
4 |
9.0 |
3 |
55.0 |
4 |
8.0 |
4 |
40.0 |
6 |
11.0 |
5 |
40.0 |
6 |
10.0 |
6 |
75.0 |
3 |
10.0 |
7 |
30.0 |
3 |
10.0 |
8 |
40.0 |
3 |
9.0 |
9 |
33.0 |
3 |
8.6 |
10 |
38.0 |
3 |
8.2 |
11 |
21.0 |
-2 |
5.0 |
12 |
30.0 |
-2 |
5.3 |
13 |
20.0 |
-1 |
4.0 |
14 |
35.0 |
-1 |
8.0 |
15 |
55.0 |
-2 |
8.0 |
16 |
40.0 |
-2 |
10.0 |
17 |
13.0 |
-3 |
6.0 |
18 |
20.0 |
-1 |
6.0 |
19 |
47.0 |
1 |
8.6 |
20 |
27.0 |
3 |
8.0 |
21 |
38.8 |
4 |
10.0 |
22 |
27.7 |
4 |
10.0 |
23 |
37.5 |
3 |
10.0 |
24 |
70.5 |
12 |
11.0 |
25 |
15.3 |
3 |
9.0 |
26 |
44.4 |
2 |
10.0 |
27 |
35.2 |
3 |
9.0 |
28 |
25.0 |
-3 |
6.5 |
29 |
23.0 |
-9 |
10.4 |
30 |
27.0 |
-1 |
10.0 |
31 |
38.0 |
-4 |
8.0 |
32 |
26.1 |
-5 |
9.0 |
33 |
38.8 |
-2 |
10.0 |
34 |
22.2 |
-5 |
9.0 |
35 |
11.7 |
-4 |
8.0 |
IMPLICATIONS OF THESE CASE STUDIES
The study shows that:
- The project eSagu had some influence on building the farming knowledge of cotton farmers;
- Positive correlation existed between compliance rate and yield of the cotton;
- On an average 50 % of the farmers studied showed a good follow-up with positive scores;
- Unnecessary sprays, using high cost chemicals for low cost, repeated use of the same chemical were some of the unwanted practices followed by the farmers observed under the study.
ENDNOTES
1 eSagu is a registered trademark of International Institute of Information Technology, Hyderabad (India).
2 Kharif is the crop growing season in India from June to November.
r denotes the correlation coefficient
** indicates significance at 1% level of significance or 99% confidence interval
* indicates significance at 5% level of significance or 95% confidence interval
ACKNOWLEDGEMENTS
This work is carried out as a part of two research projects. One is the project entitled "Web-based Agricultural Expert Advice Dissemination System" (File No.DIT/CC&BT/TDP-179 Dt. 13.2.04) supported by Ministry of Communications and Information Technology, Department of Information Technology, New Delhi, India. Another is the project entitled "Building a cost-effective and personalized eSagu" supported by Media Lab Asia, New Delhi.
REFERENCES
Krishna Reddy, P., and Ankaiah, R. (2005) "A framework if information technology-based agriculture information dissemination system to improve crop productivity".Current Science, vol. 88, Num.12 pp. 1905-1913.
Reddy, P.K., Reddy, G.S., Rao, B.R., Guruva Reddy, D., Ratnam, B.V., Reddy, P.V., and Kumaraswamy.M. (2004). "e-AGRICLINIC: An IT Based Approach for Cost –Effective and Personalised Agricultural Extension System". Paper presented at International conference on ICT for Education& Development 16-18, Bhopal, India
Reddy, P.K., Reddy, G.S.,Rao, B.R., Guruva Reddy,D., Ratnam, B.V., Reddy, P.V., and Kumaraswamy.M. (2004), "IT – Based Agricultural Extension System: Experiences with one thousand cotton farmers prototype". Paper presented at International conference on ICT for Education& Development 16-18 Dec 2004, Bhopal, India
e-Sagu: An IT- based Personalized Agricultural Extension System
http://www.esagu.in/, December 2005.
Reddy, P.K., Reddy, G.S., Reddy, A.S. and Rao, B.V. (2005). "eSagu: An IT-based Personalized Agricultural Extension System - A Prototype Experience", Seminar on Science, Technology, and Development (in the honor of Prok. Amulya K.N. Reddy on the occasion of his 75th birthday) Indian Institute of Science, Bangalore, 28 October 2005.
Reddy, P.K., Reddy, A.S., Rao, B.V. and Kumaraswamy, M. (2005). "The Application of ICT in Agriculture - The case of "eSagu" model of Web-based Agricultural Expert Advice Dissemination System", Second International Conference on Technology, Knowledge, and Society, Hyderabad, India, December 2005.
Copyright for articles published in this journal is retained by the authors, with first publication rights granted to the journal. By virtue of their appearance in this open access journal, articles are free to use, with proper attribution, in educational and other non-commercial settings.
Original article at: http://ijedict.dec.uwi.edu//viewarticle.php?id=95&layout=html
|


