Data Completeness Analysis in Malaysian Educational Management Information System
Azlinah Mohamed, Nik Abdullah Nik Abdul Kadir, Yap May-Lin, Shuzlina Abdul Rahman, and Noor Habibah Arshad
Universiti Teknologi MARA, Selangor Darul Ehsan, Malaysia
ABSTRACT
The Education Management Information System (EMIS) plays a significant role in helping the education policy-makers, decision-makers, and managers in Malaysia to make timely and good decisions. This requires high quality data to be made available to relevant people. However, EMIS has been plagued with data quality problems. Education data is important for the purpose of macro level administration and management. These data include staff emoluments, teacher deployment, school development, decision making, policy analysis, and evaluation that were gathered through the State Education Department from schools throughout the country. Since data collection involves the processes of importing, merging, and exporting at various levels, factors such as lack of facilities and skilled staff, or even data manipulation errors can affect data quality. The study aims to measure the EMIS data completeness using custom tools and to identify possible causes for EMIS data quality problems. Analysis indicates that EMIS data completeness has achieved the desired level of completeness targeted by its developers. Practical suggestions for improving the quality of EMIS data collection are presented.
Keywords: Data Quality; Data Completeness; Database; Educational Data; Information System
INTRODUCTION
Educational Management Information System (EMIS) is an information system utilized to systematically collect educational data from schools. The data collected through the use of the system have proven their value by providing data for policy and decision making in the Malaysian Ministry of Education (MOE) (KPM 2001). However, the quality of data collected has been questioned and doubts on its accuracy were raised by top MOE management themselves (Markhaini, 2003; Mohamed Ali 2001a & 2001b; Zahri, 1997). It is therefore clear that the data quality problems must be dealt with quickly. Besides that, through observation it was found that improving the quality of EMIS data collection is of utmost importance. Meanwhile, further discussion showed that EMIS data are not what the system’s planners have envisioned. The data need to be ‘cleaned’ every time they are collected from schools. There are inaccurate records, though not many, that may suffice to put doubts among data users as to the overall level of accuracy in terms of completeness. Some data are not complete and need to be filled with ‘default values’ to enable them to be used in data queries and reports. The EMIS application software itself does not include comprehensive business rules to check on the data before they are sent to the District Education Offices (DEOs) or the State Education Department (SED). Therefore, it is vital that improvements need to be done to EMIS data quality. However, before any improvement can be proposed and implemented, the current state of EMIS data quality must be determined and its source of problems should be identified. This would ensure a smooth and practical implementation of data quality improvement.
MOE is responsible for the development and management of the national education system. It adopts a centralized system of educational administration in which there are four administrative levels; Central Education Divisions (CEDs), which represent the central agencies of the education system of the country, the SED, Regional Education Offices (REOs) – for East Malaysia only, the DEO, and the schools, and the Minister of Education, who is the head of the Ministry.
The CEDs are responsible for managing the national education system, formulating national education policies and plans, establishing guidelines for their implementation and monitoring, and evaluating the outcomes of the plans. There are twenty-one CEDs, and these are generally being divided into the Professional Education Service and the Administrative Education Service. The former is responsible for professional aspects of the education system such as educational planning, teacher training and deployment, and curriculum development. These divisions report to the Director-General of Education. The latter, meanwhile, is responsible for finance, general administration, computer services, and the physical development of schools, and reports to the Secretary-General of Education.
The Educational Planning and Research Division (EPRD) is one of the CEDs in the Professional Education Service category and is the owner of the EMIS database (EPRD, 1997). In the EPRD itself, a sub-division known as Data Unit is fully responsible for every aspect of EMIS development and maintenance. The EMIS developers and programmers are Data Unit officers and selected SED officers. The group is called the ‘EMIS project team’.
THE EMIS DATA COLLECTION HISTORY
The MOE has always relied on educational data for the purpose of macro level administration and management. The data, including staff emoluments, teacher deployment, school development, decision-making, policy analysis, and evaluation are gathered through the SEDs from schools throughout the country. The collection of school-based data before the year 1976 by the MOE was not coordinated. Other divisions collected similar data to determine the distribution of teachers to schools within the country. Data are collected using collection forms. They are then calculated manually, and stored in paper files. In 1976, EPRD set out to develop an information system database for collecting, storing, processing, and analyzing educational data using the first mainframe computer acquired by the MOE. In 1981, with the help of UNESCO experts, the EPRD officers developed the Experimental Package for Relational Database Release 1 (EPRDB1). This was later upgraded to the second release in 1982, the third in 1986 and, finally the fourth release in the early 1990s, known as the Extended Package for Relational Database 4 (Markhaini, 2003; Mohamed Ali, 2001a & 2001b). The 1980s was a time of transition from a stage of initiation to a stage of expansion, as both the Computer Services Division (CSD) and other CEDs themselves began to recognize more clearly the potential of computers to support educational information management at all levels. In 1989, the Staff Information System (Sistem Maklumat Staf), a database developed by the CSD, which contained every teacher’s personal details and their professional histories, was piloted in one of the SEDs, and in 1991, it was introduced to other SEDs (Markhaini 2003). This was thought to be useful for several divisions in the MOE particularly the Schools Division and the SEDs.
The current EMIS Project started after the end of the Sixth Malaysia Plan (1991-1995), where the education programmes in the plan aimed:
- to promote and improve quality, excellence and innovation in primary and secondary schools;
- to expand equitable access to quality education;
- to improve the cost-efficiency of sectoral management so as to maximize the impact of investments.
In 1995 the MOE started a three-year EMIS project to collect and maintain data, and to disseminate information that covered government primary and secondary schools, DEO/REO, SED and several divisions in the Ministry. The implementation of EMIS data collection using the EMIS application started in June 1997 using the first release of the EMIS application software (Mokhtar, 2000). The data collection in West Malaysia was fully computerized, while in East Malaysia, only some districts in Sabah and secondary schools in Sarawak were able to participate in the computerized data collection process. Data from schools without computer facilities were obtained using data collection forms and later keyed-in at the EPRD.
The EMIS Data Collection Process
In the implementation and management of EMIS data collection at the school level, a School Data Teacher (Guru Data Sekolah) was appointed in every school through a circular letter by the Director General of Education. The teacher is responsible for keying-in, updating and correcting the EMIS data in the EMIS application. However, certain information such as the name of the school, the school code, the school location, and the school grade is fixed during the EMIS application installation process. This information can only be changed by the respective DEO Data Officer who is in charge of EMIS at the district as the information was provided by the MOE and cannot be changed without approval at the ministerial level.
After the School Data Teacher has filled in all the information, the schools then send the diskette(s) containing data to their respective DEOs. At this level, the Data Officer at the DEOs will verify data of all schools under their jurisdiction. Any missing or incomplete data will be gathered from the schools concerned and then completed by the respective DEO Data Officers. The officer in charge has to make sure that information such as the overall numbers of schools by level, session, locality, number of teachers and student enrolment are accurate for every school in the district. After this verification and validation process, Data Officers in every DEO will merge the data of all schools in the district into one file and send the diskette(s) to the SED. The process of verification and validation is repeated at this level but this time between the SED and the DEO.
EMIS data collected are geared towards providing information for budget allocation, as well as for planning purposes such as projection of teachers’ supply. Besides that, EMIS data provide information for all MOE main planning purposes such as projection of future student enrolment and building new schools. EMIS data also serve the needs of the Textbook Division to enable them to make an allocation for the textbook loan scheme for the following year.
The EMIS Database Structure
In general, for every EMIS data collection exercise, four categories of data are collected. They are Basic School Information, Basic Teacher Information, Basic Non-Teacher Information, and Student Enrolment Information. The basic structure of EMIS database contains 28 data tables, and 91 domain codes tables.
- Basic School Information category consists of 15 data tables. The main data table is TSekolah. This table contains basic profile information of a school. The primary key for this table is KODSEK, which is the school code. The school code is assigned by the EPRD when a request for school registration is submitted to the MOE. The code is used as the key identifier for every government school in the country. Other tables contain information about school land areas, buildings, classrooms, quarters, and other facilities, including toilets and parking lots.
- Student Enrolment Information category consists of three data tables. The main data table is TEnrolmen1Jad. This table contains the number of students per class and classes’ information in a school. Other tables contain information on the number of students with specific conditions.
- Basic Teacher Information category consists of nine data tables. The main data table is TGGuru. This table contains basic personal and service information of a teacher. The primary key for this table is KPUtama or the Identity Card Number, which is also the key identifier for every citizen of the country. Other tables contain information about teacher academic and professional qualifications, subjects taught, in-service training, co-curriculum activities, allowances, and responsibilities at school. The four tables used here (TGBElaun, TGBKelulusanAkademik, TGBLDP, and TGBTarikh) are also shared tables used to store the same information for non-teachers.
- Basic Non-Teacher Information category consists of five data tables. The main data table is TBBGuru. This table contains basic personal and service information of a non-teaching staff. The primary key for this table is KPUtama or the Identity Card Number. Other tables are shared tables with Basic Teacher Information category as described previously.
Through observations, discussions, experiences, and feedbacks from school level, some of the difficulties identified were:
- the EMIS data was not regularly used in decision making processes at all levels in the education system;
- insufficient commitment from the top management;
- insufficient co-operation and collaboration among the various levels and across CEDs in the education system;
- lack of basic supporting facilities at school level; and
- the EMIS application software and database problems (either in its design, user-friendliness, or in other technical issues).
Interestingly, all of the above difficulties are either the result of or the contributor to data quality problems. It was found that the MOE was aware of the issue and the need to address the issues of improving data quality. A number of solutions were proposed and implemented such as promoting EMIS data usage to the MOE top management, reporting of schools having inaccurate EMIS data, and introducing Web-based EMIS application. Another factor that could lead to the issue is the human factor. Since schools are not directly accountable to the EPRD, some school administrators do not regard the task of providing complete and accurate data as crucial. Thus, EMIS data collection was not given the right priority.
However, none of the above claims can be substantiated without a clear view of the current level of data quality. Is the data quality actually poor, or is it only a misinformed and biased perception? In order to improve data quality, a measurement for EMIS data quality is needed. This will provide the benchmark for the data quality improvement.
Therefore, this paper discusses one aspect of the data quality that is data completeness. The specific objectives of this paper are:
- to develop a tool for EMIS data completeness measurement;
- to measure EMIS data completeness; and
- to identify the parts of EMIS that do not achieve data completeness target.
DEFINING DATA QUALITY
Data is the plural form of datum – a Latin word – which means “something given” (English 1999). Oxford Advanced Learner’s Dictionary defines data as (a) “facts or information used in deciding or discussing,” (b) “information prepared for or stored by a computer” (Hornby 1995). Thus, according to Rothenberg (1996) and English (1999), data may well be the representation or model of things or entities in the real world.
According to Wang et al. (1993), quality can be defined as “conformance to requirements”. Cappiello et al. (2004) on the other hand, described quality as “fitness for use” which could also mean the ability to meet user requirements. The arguments show that there are two views on data quality definitions (Kahn, et al 2002). The first is favored among producers and custodians since specifications can be defined and measured. The second view is usually taken by product designers and marketing. However, it is difficult to measure since consumer expectations may change over time. Given all the above definitions, conclusions can be made on the definition of data quality. Since the study focuses more on the technical aspects of EMIS and the ‘customer’ or data user is none other than the MOE itself, the most appropriate definition would be “conformance to requirements”. The requirements would also be easier to characterize and define using data quality target values. To further understand the meaning of data quality, its dimensions and characteristics would need to be investigated.
Data Quality Dimensions
In general, data quality can be viewed in two different perspectives. English (1999) suggests that data quality possesses both inherent and pragmatic quality. Inherent quality is simply accuracy; an equivalent reproduction of real entity. On the other hand, pragmatic quality covers usefulness and value. Wang et al. (1995) added more perspectives to data quality dimensions such as accessible, interpretable, useful, believable, and etc. Meanwhile, Pipino et al. (2002) described data quality dimensions as accessibility, amount of information, believability, completeness, concise representation, consistent representation, ease of manipulation, free-of-error, interpretability, objectivity, relevancy, reputation, security, timeliness, value-added, ease of understanding, and value-added (Kahn, et al 2002; Pipino, et al. 2002). The main types of data quality errors that occur in digital libraries were also mentioned by Beall (2005), who focused on both metadata errors and errors in the actual documents, and summarized the issues and possible solutions.
Implementing Data Quality Improvement
Poor information quality can create chaos. Unless its root cause is diagnosed, efforts to address it are likely to fail. Strong et al. (1997a; 1997b) described ten key data quality problems and some of the related problems are multiple sources of the same information produce different values, large volumes of stored information make it difficult to access information in a reasonable time, distributed heterogeneous systems lead to inconsistent definitions, formats, and values, and many more.
In order to solve data quality problems, a guideline is needed for data quality measurement, assessment, and improvement processes. There are a number of different frameworks that have been proposed for the purpose. As an example, through the Total Quality data Management (TQdM) program, Wang (1998) proposed a framework based on product perspective (Wang et al.,1995; 2001). According to English (1999), the TQdM method consisted of five processes of measuring and improving data quality, with an umbrella process for sustaining the data quality improvement as a management tool and a habit by bringing about cultural and environmental changes. Interested readers can refer to Zhu et al. (2007) who have provided critical comments on results from various studies for solving low quality data.
THE RESEARCH METHOD OF THE STUDY
This study aims at measuring data quality of EMIS by measuring three basic data quality dimensions; data completeness, data domain validity and business rules conformance, and data accuracy. Based on previous literature, methods for the measurements are described in this section. The measurement methods are based on the modified Total Quality data Management (TQdM) method proposed by (English 1999). The second process “P2” that is “Access Information Quality” is the focus of this study. English (1999) suggested that measuring data quality is akin to measuring manufacturing product quality. The research methodology of the study is as shown in Figure 1 below. However, this paper focuses on the data completeness of EMIS.
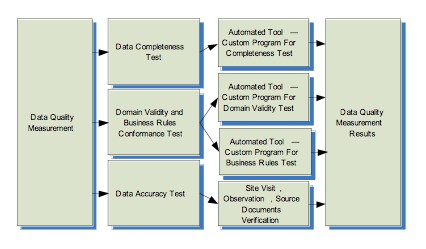
Figure 1: The research methodology framework
The first data quality dimension covered in the study is completeness. It is the characteristic of having all required values for the data fields. In order to measure completeness, English (1999) suggests an assessment of the percent of records having non-null value for specific fields in a database.
Table 1: Optional fields in EMIS database with completeness requirements
Table Name |
Mandatory Fields |
Optional Fields |
Completeness Requirements for Optional Fields |
Basic School Information |
TSekolah |
20 fields |
49 fields |
17 fields |
TSBangunan |
3 fields |
5 fields |
3 fields |
TSBilik |
2 fields |
3 fields |
3 fields |
TSHarta |
5 fields |
2 fields |
2 fields |
TSJenisJalan |
1 field |
- |
- |
TSKenderaan |
5 fields |
2 fields |
2 fields |
TSPCG |
2 fields |
- |
- |
TSProgramPelajar |
2 fields |
- |
- |
TSRumah |
3 fields |
8 fields |
4 fields |
TSSukan |
2 fields |
2 fields |
2 fields |
TSSumberPeruntukan |
2 fields |
- |
- |
TSSwasta |
2 fields |
- |
- |
TSTanah |
3 fields |
3 fields |
3 fields |
TSTandas |
3 fields |
4 fields |
- |
TSTempatLetak |
2 fields |
2 fields |
- |
Student Enrolment Information |
TEnrolmen1Jad |
4 fields |
8 fields |
8 fields |
TEnrolmen |
2 fields |
9 fields |
8 fields |
TEMaklumatJadualWargaAsing |
2 fields |
2 fields |
2 fields |
Basic Non-Teacher Information |
TBBGuru |
18 fields |
22 fields |
12 fields |
TGBElaun |
1 field |
1 field |
1 field |
TGBKelulusanAkademik |
3 fields |
3 fields |
2 fields |
TGBLDP |
2 fields |
2 fields |
2 fields |
TGBTarikh |
1 field |
1 field |
1 field |
Basic Teacher Information |
TGGuru |
24 fields |
28 fields |
12 fields |
TGBElaun |
1 field |
1 field |
1 field |
TGBKelulusanAkademik |
3 fields |
3 fields |
2 fields |
TGBLDP |
2 fields |
2 fields |
2 fields |
TGBTarikh |
1 field |
1 field |
1 field |
TGIkhtisas |
3 fields |
3 fields |
2 fields |
TGKoKurikulum |
2 fields |
-
|
- |
TGMataPelajaran |
2 fields |
2 fields |
2 fields |
TGTugasKhas |
1 field |
-
| - |
EMIS database contains two types of fields; mandatory and optional fields. The mandatory fields consist of primary key fields such as school code, NRIC number and other related database enforced fields. These fields therefore cannot contain nulls. It is the optional fields that need to be checked for completeness. In basic school information for example, we have TSekolah’s table having 20 fields and 49 optional fields and only 17 out of 49 optional fields are having values that will be used to assess the completeness. Although it is not enforced in the database for these fields to be completed, many of these fields still fall into the ‘mandatory’ category according to circumstances. An example is the field KODSEKTUMPANG in table TSekolah that is only filled when KODTUMPANG contains the value “2” and “3”. Table 1 above provides a summary of the optional fields. For the purpose of this research, the researchers have ensured that all the required mandatory category data are completed.
Automated Assessment Tool for Completeness Measurement
Automated data assessment is data quality inspection using software tools to measure data completeness. Such tools can perform the function quickly and on large data sets.
For each table in EMISdatabase
For each field in table
Run_Query “SELECT count(*) as NumOfComplete
FROM table
WHERE field is not null”
Print table.name, field.name, NumOfRec, NumOfComplete
Next
Next
|
Figure2: Core data completeness inspection pseudo codes
In order to perform data completeness measurement on EMIS database, a small custom program was created using Microsoft Access 2003’s Visual Basic for Applications (VBA). The core of the program essentially inspects every field in every data table in the EMIS database using the pseudo codes illustrated in Figure 2. The outputs of the program are saved into a database table for EMIS data quality completeness analysis.
Data Quality Target for Completeness Measurement
Data quality target is used to describe the levels of required quality for the completeness dimension. Since there are no known previous attempts to measure EMIS data quality and no indicators for such measurements, the researchers and the EMIS project team have agreed on a target indicator to measure EMIS data completeness. The data quality target indicator for this dimension is 90% data completeness.
RESULTS AND ANALYSIS
An automated data completeness tool was used to gather the data for this analysis. The tool has measured the EMIS database as of June 30th, 2005 for the Federal Territory of Kuala Lumpur. The measurement covers the complete population of 287 schools in Kuala Lumpur with 15954 teacher records, 2185 non-teaching staff records, and 8204 classes’ records.
There are 32 tables (4 tables are common physical tables for teachers and non-teachers) with 302 combined numbers of fields which were tested. The test only examined whether the data field contained a null or any other value. A null will render the data field to be incomplete. Figure 3 presents an overall view of the results obtained from the data completeness measurement. There are
13 out of 15 tables under basic school information that achieved 100% completeness, two out of three tables in student enrolment and only two out of nine in basic teacher information achieved similar results. None of the tables in basic non-teacher information achieved 100% completeness. The results show that data table TGBLDP (for both teacher and non-teacher) achieved far below the 90% target compared to the other tables. All other tables are above the target indicator for data completeness (90%).
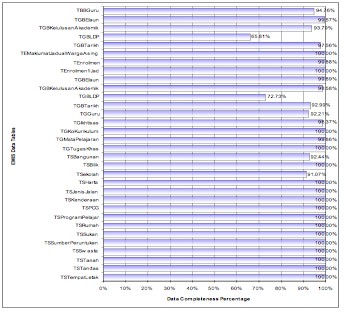
Figure3: Summary of data completeness by EMIS data tables
Tables 2 to 5 present the details of data completeness measurement results divided into four EMIS basic information categories. The fields are sorted so as to reveal the most incomplete fields in a table. Fields that achieve 100 percent completeness are not displayed. In Table 2 below, most of Basic School Information tables are 100% complete except for two tables; TSekolah and TSBangunan. There are five fields that achieve very low percentage of completeness (less than 10%). The fields are MUKIM, KODDUN, KODBEKALANMAKANAN, KODKANTINASRAMA, and KODSEKTUMPANG. It is noted that none of the fields for MUKIM and KODDUN are filled with values due to the fact that the Federal Territory do not have any State Legislative Council. Although the Federal Territory does have Mukims, the schools have difficulties in determining and interpreting their Mukims and as a result, they enter the incorrect value. Thus, the Kuala Lumpur SED decided that the field should be left empty for the Department to fill it in at a later stage. The values for fields KODBEKALANMAKANAN and KODKANTINASRAMA, on the other hand, depend on the condition that a school has a hostel. KODSEKTUMPANG also depends on the condition that the field value for KODTUMPANG is either “2” or “3” only.
Table 2: Basic School Information data completeness results
Table Name |
Field Name |
Record Count |
Complete Data |
Completeness Percent |
TSekolah |
MUKIM
KODDUN
KODBEKALANMAKANAN
KODKANTINASRAMA
KODSEKTUMPANG
BilMuridInklusif
BilKelasInklusif
HOMEPAGE
BILKELASCANTUM
JUMMURIDCANTUM
NomborPendaftaranSekolah
EMAIL
LUASRUANGMAKANKANTINSEK
KODDAPURASRAMA
LuasKawasanTerbina
JARAKLETRIK
JARAKPPD
NOFAX
SEJARAH
OPTIMUMSekolah |
287
287
287
287
287
287
287
287
287
287
287
287
287
287
287
287
287
287
287
287 |
0
0
21
21
23
181
182
184
195
195
243
260
276
278
280
284
285
286
286
286 |
000.00 %
000.00 %
007.32 %
007.32 %
008.01 %
063.07 %
063.41 %
064.11 %
067.94 %
067.94 %
084.67 %
090.59 %
096.17 %
096.86 %
097.56 %
098.95 %
099.30 %
099.65 %
099.65 %
099.65 % |
TSBangunan |
LuasKawasanTerbina |
1266 |
500 |
039.49 % |
The result for Student Enrolment Information data completeness measurement (Table 3) indicates that only one field in this category contains incomplete data, which is JUMKELAS from the table TEnrolmen.
Table 3: Student Enrolment Information data completeness results
Table Name |
Field Name |
Record Count |
Complete Data |
Completeness Percent |
TEnrolmen1Jad |
|
8204 |
8204 |
100.00 % |
TEnrolmen |
JUMKELAS |
6551 |
6465 |
098.69 % |
TEMaklumatJadualWargaAsing |
|
487 |
487 |
100.00 % |
It is noted that JUMKELAS is a field where the value depends on the type of Enrolment in KODBUTREKOD. Enrolment type other than “2” (students taking elective classes), “8” (students register for Year 1), and “1D” (disabled students) do not mandate a value for JUMKELAS. Thus, JUMKELAS should contain the value “0” and not Null values. Further inspection of the records reveals that the Null value originates from legacy EMIS application pre-version 3.x records. The EMIS application and database before version 3 regard Null values as equivalent to zero value.
Table 4:Basic Non-Teacher Information data completeness results
Table Name |
Field Name |
Record Count |
Complete Data |
Completeness Percent |
TBBGuru |
CATATAN |
2185 |
93 |
4.26 % |
TBBGuru |
Email |
2185 |
631 |
28.88 % |
TBBGuru |
KPLAIN |
2185 |
1724 |
78.90 % |
TBBGuru |
NomborGaji |
2185 |
2053 |
93.96 % |
TBBGuru |
UmurOpsyenBersara |
2185 |
2113 |
96.70 % |
TBBGuru |
BULANNAIKGAJI |
2185 |
2151 |
98.44 % |
TBBGuru |
AlamatBandarSurat |
2185 |
2162 |
98.95 % |
TBBGuru |
AlamatBandar |
2185 |
2165 |
99.08 % |
TBBGuru |
KodGelaran |
2185 |
2167 |
99.18 % |
TBBGuru |
NOTELEFONSEMASA |
2185 |
2172 |
99.41 % |
TBBGuru |
AlamatPoskodSurat |
2185 |
2174 |
99.50 % |
TBBGuru |
AlamatPoskod |
2185 |
2175 |
99.54 % |
TBBGuru |
KodAlamatNegeriSurat |
2185 |
2176 |
99.59 % |
TBBGuru |
KodAlamatNegeri |
2185 |
2180 |
99.77 % |
TBBGuru |
STATUSKAHWIN |
2185 |
2182 |
99.86 % |
TBBGuru |
AlamatRumahSurat |
2185 |
2182 |
99.86 % |
TBBGuru |
AlamatRumah |
2185 |
2182 |
99.86 % |
TBBGuru |
AGAMA |
2185 |
2183 |
99.91 % |
TGBElaun |
Amaun |
4446 |
4408 |
99.15 % |
TGBKelulusanAkademik |
KodPengkhususan2 |
2391 |
1547 |
64.70 % |
TGBKelulusanAkademik |
Tahun |
2391 |
2362 |
98.79 % |
TGBKelulusanAkademik |
NamaInstitusi |
2391 |
2373 |
99.25 % |
TGBLDP |
Kursus |
857 |
123 |
14.35 % |
TGBLDP |
Tahun |
857 |
126 |
14.70 % |
TGBTarikh |
Tarikh |
13322 |
12671 |
95.11 % |
In Table 4, measurement results for Basic Non-Teacher Information data completeness revealed that in table TBBGuru there are three optional fields having completeness percentages below average; CATATAN, Email, and KPLAIN. For the field CATATAN, it is expected to have such a low value as the field is filled only when necessary. It is obvious that only a small number of supporting staffs at schools has email addresses. For the field KPLAIN or the Old Identity Card Number, further investigation of the records revealed that 96% of the null values came from staff born in the year 1978 and later. Furthermore, the Old Identity Card Number became obsolete by the end of the 2005 year. The In-Service Training Information Table or TGBLDP has a very large gap between incomplete fields (Kursus and Tahun) and other fields in the table which achieved 100% completeness. A query on the LastModifiedDate field of the records revealed that 89.5% of the records were dated 28th April, 2002; the date of the first EMIS data conversion from version 2.x to version 3.x. Another 4% of the records were dated before the year 2004. It is noted that the fields Kursus and Tahun were introduced in version 3.x. Thus, converted records would certainly contain nulls in both of these fields.
In Table 5, measurement results for Basic Teacher Information data completeness revealed many similarities found in previous analysis of Basic Non-Teacher Information measurement results. In the main table, TGGuru, five fields achieved completeness percentage below average. They are PengkhususanGPR, CATATAN, NoSiriNoteBook, Email, and KPLAIN. For the field CATATAN, a low value was expected as the field is filled only when necessary. It is also clear from the analysis that only a small number of teachers have email addresses. For the field KPLAIN or the Old Identity Card Number, further investigation of the records revealed the same results as the previous analysis on Non-Teacher data. There are 96.4% of null values that came from teachers born in the year 1978 and later. The fields PengkhususanGPR and NoSiriNoteBook are two “new” fields introduced at the end of the year 2004. The field PengkhususanGPR depends on the value for JAWATAN equal to “GPR”. The same is true for NoSiriNoteBook, as it requires the PPSMI field to have true values.
Table 5: Basic Teacher Information data completeness results
Table Name |
Field Name |
Record Count |
Complete Data |
Completeness Percent |
TGGuru |
PengkhususanGPR |
15954 |
40 |
0.25 % |
TGGuru |
CATATAN |
15954 |
2118 |
13.28 % |
TGGuru |
NoSiriNoteBook |
15954 |
3210 |
20.12 % |
TGGuru |
Email |
15954 |
5190 |
32.53 % |
TGGuru |
KPLAIN |
15954 |
12662 |
79.37 % |
TGGuru |
NomborGaji |
15954 |
14702 |
92.15 % |
TGGuru |
PTK |
15954 |
15547 |
97.45 % |
TGGuru |
UmurOpsyenBersara |
15954 |
15570 |
97.59 % |
TGGuru |
GREDGAJIMEMANGKU |
15954 |
15587 |
97.70 % |
TGGuru |
NOTELEFONSEMASA |
15954 |
15813 |
99.12 % |
TGGuru |
AlamatBandar |
15954 |
15853 |
99.37 % |
TGGuru |
AlamatBandarSurat |
15954 |
15870 |
99.47 % |
TGGuru |
BULANNAIKGAJI |
15954 |
15872 |
99.49 % |
TGGuru |
SIDANGAJAR |
15954 |
15879 |
99.53 % |
TGGuru |
AlamatPoskod |
15954 |
15910 |
99.72 % |
TGGuru |
KodAlamatNegeri |
15954 |
15918 |
99.77 % |
TGGuru |
AlamatPoskodSurat |
15954 |
15926 |
99.82 % |
TGGuru |
KodGelaran |
15954 |
15931 |
99.86 % |
TGGuru |
AlamatRumah |
15954 |
15936 |
99.89 % |
TGGuru |
KodAlamatNegeriSurat |
15954 |
15945 |
99.94 % |
TGGuru |
KURSUSINDUKSI |
15954 |
15945 |
99.94 % |
TGGuru |
STATUSKAHWIN |
15954 |
15946 |
99.95 % |
TGGuru |
AlamatRumahSurat |
15954 |
15947 |
99.96 % |
TGGuru |
JUMWAKTU |
15954 |
15953 |
99.99 % |
TGBElaun |
Amaun |
32804 |
32730 |
99.77 % |
TGBKelulusanAkademik |
KodPengkhususan2 |
17284 |
15954 |
92.31 % |
TGBKelulusanAkademik |
Tahun |
17284 |
17200 |
99.51 % |
TGBKelulusanAkademik |
NamaInstitusi |
17284 |
17228 |
99.68 % |
TGBLDP |
Kursus |
11816 |
3748 |
31.72 % |
TGBLDP |
Tahun |
11816 |
3775 |
31.95 % |
TGBTarikh |
Tarikh |
101149 |
86978 |
85.99 % |
TGIkhtisas |
KodOpsyen2 |
15573 |
14156 |
90.90 % |
TGIkhtisas |
Tahun |
15573 |
15513 |
99.61 % |
TGIkhtisas |
NamaInstitusi |
15573 |
15529 |
99.72 % |
TGKoKurikulum |
|
34985 |
34985 |
100.00 % |
TGMataPelajaran |
BilWaktuMengajar |
35525 |
35415 |
99.69 % |
TGMataPelajaran |
BilTahunPengalaman |
35525 |
35443 |
99.77 % |
TGTugasKhas |
|
18721 |
18721 |
100.00 % |
As in the case of the previous Non-Teacher Information analysis, the In-Service Training Information Table or TGBLDP also indicated a large gap between incomplete fields (Kursus and Tahun) and other fields in the table which achieved 100% completeness. A query on the LastModifiedDate field of the records revealed that 90% of the records were dated 28th April, 2002. This is the date of the first EMIS data conversion from versions 2.x to version 3.x. It is noted that the fields Kursus and Tahun were introduced in version 3.x. Thus, converted records would certainly contain nulls in both of these fields. This shows that the records for in-service training were not updated together with the other tables.
CONCLUSION
In general, evidence shows that EMIS data completeness for all data tables except one has managed to achieve the targeted minimum value of 90% for data completeness. Seventeen of the tables even managed to achieve 100% completeness. If the data table TGBLDP had reached the data quality target for data completeness, then the EMIS data would certainly be considered complete.
It is clear that TGBLDP is the most problematic table in this dimension of data quality. It has affected the EMIS data as a whole to satisfy the minimum target of data quality. Thus, from the analysis, several causes of data completeness problems have been identified as follows:
- EMIS versions incompatibility
It was found that the In-Service Training Information Table or TGBLDP has a large number of incomplete fields (Kursus and Tahun) due to EMIS data conversion from version 2 to version 3 as the fields Kursus and Tahun were introduced in version 3. Thus, the newly converted records would certainly contain nulls in both of these fields. There are also null values that originated from the legacy EMIS application version 2, which allowed the nulls. However, the null values were not converted accordingly to zero or empty strings although new records created in version 3 did not exhibit this problem;
- Fields classification and requirement
Theoretically, all fields are supposed to have correct specification and requirements. However, in EMIS, there are fields that are marked as required but in reality, the value could be null such as KODDUN field for the Federal Territory. Other fields are not completed and contain nulls because the fields themselves are not marked as required such as CATATAN and Email. There are also fields that depend on other field values for their own values such as KODSEKTUMPANG with KODTUMPANG;
There are field values that may no longer be needed in the future. This is the case for the field KPLAIN or the Old Identity Card Number. The evidence showed that in the future, the field would likely contain more and more null values as the number of staff born after the year 1978 increased. Furthermore, the Old Identity Card Number would no longer be accepted for government services by the end of the year 2005;
- Human error and carelessness
Evidence showed that records are not updated or even checked for their completeness. This happened to many tables and fields like the TGBLDP table, TGGuru table, and others. The null values in JUMKELAS field from the table TEnrolmen, for example, is supposed to contain the value “0” and not null values.
Based on the findings and discussions above, the study recommends the following for improving future EMIS data completeness:
- EMIS version compatibility must be resolved. A short-term solution would be to create an automated program that will search for the problem and suggests corrective actions to the Data Teachers and other users by preventing null attributes using default values. A long-term solution would be to re-write the conversion module to cover all of the issues detected;
- EMIS data fields must be re-evaluated for their requirements, future values, and correctness; and
- Relationships between fields must be clearly defined and communicated to end users.
REFERENCES
Beall, J. 2006 “Metadata and Data Quality Problems in the Digital Library”. Journal of Digital Information, Volume 6, no. 3, 355, 2005-06-12
Cappiello, C., Francalanci, C. & Pernici, B. 2004, “Data Quality Assessment from the User’s Perspective”. Proceedings of the 2004 International Workshop on Information Quality in Information Systems, June 2004, pp. 68-73.
Educational Planning and Research Division (EPRD), Harvard Institute for International Development and The University at Albany. 1997, “A Plan for the Development of an Education Management Information System for the Education System of the Government of Malaysia”. Kuala Lumpur: Ministry of Education.
English, L. P. 1999, “Improving Data Warehouse and Business Information Quality: Methods for Reducing Costs and Increasing Profits”, New York: John Wiley & Sons.
Hornby, A. S. 1995, “Oxford Advanced Learner’s Dictionary”, 5th Ed, London: Oxford University Press.
Kahn, B., Strong, D. & Wang, R. 2002, “Information Quality Benchmarks: Product and Service Performance”, Communications of the ACM, vol. 45, no. 4, pp. 184-192.
Kementerian Pendidikan Malaysia (KPM) 2001,”Pembangunan Pendidikan 2001-2010: Perancangan Bersepadu Penjana Kecemerlangan Pendidikan”, Kuala Lumpur: Kementerian Pendidikan Malaysia.
Markhaini Wati Sarwani 2003, “The Knowledge and Perspectives about Educational Management Information System (EMIS/SMPP) of Decision-Makers in the Malaysian Ministry of Education (MMOE): An inquiry into the implementation of an EMIS”, Unpublished PhD Thesis, University of Warwick.
Mohamed Ali Abdul Rahman. 2001a, “Ke Arah Peningkatan Kualiti Data dan Penggunaannya Di Sekolah: Rumusan Kajian”, Prosiding Seminar Kebangsaan Pengurusan Maklumat Pendidikan SMPP/EMIS 2001, Kementerian Pendidikan Malaysia, pp. 115-131.
Mohamed Ali Abdul Rahman. 2001b, “Towards Increasing the Use of Computerised Information Systems and Data Quality in Schools-The State of Selangor”, Malaysia, Unpublished PhD Thesis, The University of Reading.
Mokhtar Sarbaini. 2000, ”Sistem Maklumat Pengurusan Pendidikan (SMPP)”. Prosiding Seminar Kebangsaan Pengurusan Maklumat Pendidikan SMPP/EMIS 2000, Kementerian Pendidikan Malaysia, pp. 51-82.
Pipino, L., Lee, Y. & Wang, R. 2002, “Data Quality Assessment”, Communications of the ACM, vol. 45, no. 4, pp. 211-218.
Rothenberg, J. 1996, “Metadata to Support Data Quality and Longevity”. IEEE Computer.org. 3 June 1996. Retrieved on 15 Feb. 2005 from http://www.computer.org/conferences/meta96/rothenberg_paper/ieee.data�]quality.html
Strong, D., Lee, Y. & Wang, R. 1997a, “10 Potholes in the Road to Information Quality”, IEEE Computer, vol. 30, no. 8, pp. 38-46.
Strong, D., Lee, Y. & Wang, R. 1997b, “Data Quality in Context”. Communications of the ACM, vol. 40, no. 5, pp. 103-110.
Wang, R. (1998). “A Product Perspective on Total Data Quality Management”, Communications of the ACM, vol. 41, no. 2, pp. 58-65.
Wang, R., Kon, H. & Madnick, S. 1993, “Data Quality Requirements Analysis and Modeling”, Proceedings of the Ninth International Conference of Data Engineering, April 1993, pp. 670-677.
Wang, R., Reddy, M.P. & Kon, H.B. 1995, “Toward Quality Data: An Attribute-Based Approach”, Decision Support Systems, vol. 13, pp. 349-372.
Wang, R., Storey, V. & Firth, C. 1995, “A Framework for Analysis of Data Quality Research”, IEEE Transactions on Knowledge and Data Engineering, vol. 7, no. 4, pp. 623-640.
Wang, R., Ziad, M. & Lee, Y. 2001, “Data Quality”, Massachusetts: Kluwer Academic Publishers.
Zahri Aziz. 1997, “The Use of Computer-based Information Systems for Policy Development in the Ministry of Education”, Malaysia, Unpublished PhD thesis, University of Leeds.
Zhu. X., Khoshgoftaar, T. M., Davidson, I., and Zhang, S. (2007), Knowl Inf Syst (2007) 11(2): 131–136
Copyright for articles published in this journal is retained by the authors, with first publication rights granted to the journal.
By virtue of their appearance in this open access journal, articles are free to use, with proper attribution, in educational and other non-commercial settings. Original article at: http://ijedict.dec.uwi.edu//viewarticle.php?id=477&layout=html
|