Academic computing at Malaysian colleges
Shamsul Anuar Mokhtar, Rose Alinda Alias and Azizah Abdul Rahman
Universiti Teknologi Malaysia, Malaysia
ABSTRACT
The paper describes the state of academic computing at Malaysian colleges. Three research questions are central to this study. What are the indicators for assessing academic computing? What are the general characteristics of academic computing at different levels of performance? What is the general performance of academic computing at colleges in Malaysia? In order to answer these questions, an academic computing survey was conducted involving 62 public and private colleges in Malaysia. The questionnaire used in the survey was based on the academic computing assessment framework developed by Mokhtar et al. (2006). The survey incorporated 46 rubric questions encompassing six academic computing areas: 1) ICT Vision, Plan, Policies and Standards; 2) ICT Infrastructure; 3) Teaching and Learning Using ICT; 4) Researching Using ICT; 5) Information Services; and 6) Institutional ICT Support. The findings of this study showed that a majority of colleges in Malaysia were implementing some aspects of academic computing. However the academic computing performances varied between areas and between colleges. As a comparison, a smaller percentage of Malaysian colleges achieved moderate or high academic computing performance compared with their counterparts in the United Kingdom.
Keywords: Academic computing; higher education; assessment; survey.
INTRODUCTION
Since the 1990s, information and communication technology (ICT) has advanced very rapidly in Malaysia. To a certain extent, what propels ICT to the forefront was Malaysia's intention to be a fully developed nation by the year 2020 – a concept now widely known as Vision 2020. To achieve this ambitious goal, the Malaysian government began to look to ICT to provide the required human resources through efficient education and training. Its impact on education, while not yet pervasive, has made considerable inroads. Various projects related to ICT implementation in education are implemented, including the Computer-in-Education project, Knowledge Resource Centre, Computer Aided Instruction and Computer Aided Learning project, and the Smart School Project (Gan, 2001).
At present, the ICT strategy in driving the Malaysian higher education towards excellence is described in a document entitled "Report by the Committee to Study, Review and Make Recommendations Concerning the Development and Direction of Higher Education in Malaysia" (Ministry of Higher Education Malaysia, 2006). The report discusses the role of ICT in achieving this excellence, focussing on the use of ICT in relation to and in support of the core areas of higher education, namely teaching-learning and research. Such scope of ICT use is aptly represented by academic computing (Prupis, 1989; Ferrer and Corya, 1990; Van Valey and Poole, 1994; Nielsen et al.,1995; Carleton University, 2001).
The report highlights the importance of higher education institutions in conducting ongoing assessment of standards and performance. It recommends the use of performance indicators and benchmarking in relation to all important areas of higher education. The instrument used for the assessment should be adapted to the specific needs of the Malaysian higher education institutions. A well-constructed instrument will provide substantial information on the performance and quality of each aspect being assessed. The information can be pooled and utilised by interested parties and can enable the management of higher education institution to fully grasp and understand issues and problems, and make decisions that are reliable and accurate. Comparisons of performances can stimulate healthy competition amongst higher education institutions at the national level. In addition, the management can plan and organise detail strategies that can remedy weaknesses and reinforce efforts (Ministry of Higher Education Malaysia, 2006).
However, the implementation of ICT in higher education is generally autonomous and what has been achieved is relatively unknown (Gan, 2001). Research by UNESCO (2004) found that many Asia-Pacific countries including Malaysia lack the proper framework to assess ICT implementation in higher education. Therefore, initiatives to gather assessment information and data, either by a central body or higher education institutions themselves, are essential in achieving the ICT strategy (Ministry of Higher Education Malaysia, 2006).
The purpose of this study is to describe the state of academic computing at Malaysian colleges. Several research questions are central to this study. What are the indicators for assessing academic computing? What are the general characteristics of academic computing at different levels of performance? What is the general performance of academic computing at colleges in Malaysia? In order to answer these questions, an academic computing survey was conducted involving 62 public and private colleges in Malaysia. The questionnaire for the survey was based on the academic computing assessment framework developed by Mokhtar et al. (2006).
THE THEORETICAL FRAMEWORK
Before proceeding with the methodology of the study, this section provides a brief description of the theoretical framework in which the study is based on. The academic computing assessment framework was developed by Mokhtar et al. (2006) based on a qualitative study of higher education institutions in Malaysia. The framework adapts the value chain concept, initially proposed by Porter (1985) for the business field, to describe the relationships between academic computing activities. The framework consists of two groups: primary activities and support activities. The structure of the framework is shown in Figure 1.
Primary activities are directly concerned with the use of ICT in delivering the core higher education services. The primary activities are represented by two academic computing areas, namely Teaching and Learning Using ICT and Researching Using ICT. The use of ICT in teaching and learning is essential as it enhances the teaching and learning process, facilitates lifelong learning and enables borderless education. The use of ICT in research enables faster and higher precision data processing, simulation of complex systems, collaboration between researchers across time and space, and remote access to data and specialised research facilities (Mokhtar et al., 2006).
The primary activities are linked to support activities that help to improve their effectiveness or efficiency. The framework categorises the support activities into four main areas, namely ICT Vision, Plan, Policies and Standards, ICT Infrastructure, Information Services and Institutional ICT Support. First and foremost, the role of ICT vision, plan, policies and standards is very important due to the long and expensive process of implementing academic computing. Higher education institutions must carefully consider all academic computing issues and employ the necessary policies to ensure successful academic computing implementation. Secondly, higher education institutions must provide the necessary ICT infrastructure as a foundation to academic computing. Its absence forms a barrier to institutions providing ICT-enabled education offerings, therefore gives an adverse effect on the quality of higher education as a whole. Thirdly, ICT based information services allows easy access to information and knowledge in various disciplines, thus supporting the teaching process and enhancing the learning experience for students. Finally, institutional ICT support ensures the smooth and effective use ICT in teaching and learning through ICT training, maintenance of infrastructure and assistance to users (Mokhtar et al., 2006).
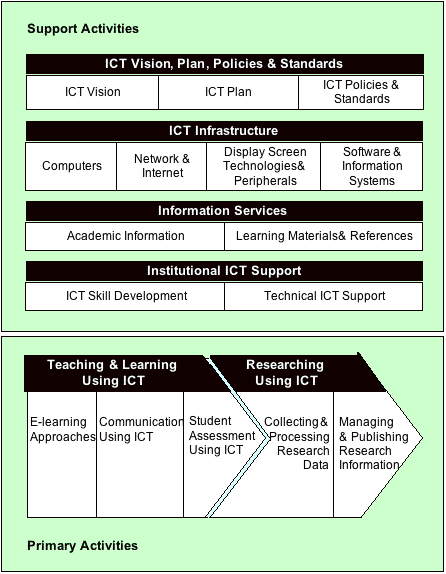
Figure 1: The academic computing assessment framework. Adapted from Mokhtar et al. (2006).
In the framework, the most basic building blocks are the performance indicators. Although some authors suggest that performance indicators must be something that is quantifiable, some others take a much wider view, and would include descriptive statements within the scope of indicators (Nuttall, 1994). The latter view is adopted by the International Standards Organisation, which defines a performance indicator as "a numerical, symbolic or verbal expression derived from statistics and data that characterises the performance of a service or facility" (International Standards Organisation, 1998). Mokhtar et al. (2006) adopts a similarly view, and incorporates both quantitative and qualitative measures in the framework. This allows performance indicators to portray the full richness and diversity of the academic computing activities.
To ensure the validity of the indicators, only indicators considered important by the ICT and academic management of the higher education institutions involved in the qualitative study were incorporated in the academic computing assessment framework. The indicators were also able to differentiate various levels of academic computing performance. For each of these indicators, at least three different descriptions or values were extracted. These variations were arranged in a particular order that reflects the flow of academic computing development from a low level of performance to the highest level of performance. The variations for all the indicators were used to form the academic computing rubrics.
According to Pickett (1998), rubrics are sets of categories that define and describe the important components of the areas being assessed. Each category contains a gradation of performance levels with a score assigned to each level and a clear description of what criteria need to be met to attain the score at each level. As an assessment tool, rubrics are effective in evaluating institutional performance in areas that are complex and vague. Rubrics representing the low, moderate and high level of academic computing performance for each indicator are presented in Appendix A.
METHODOLOGY
As mentioned earlier, the purpose of this study is to describe the state of academic computing at Malaysian colleges. Colleges, in the context of this study, refer to non-university status higher education institutions registered with the Ministry of Higher Education. The colleges encompass polytechnics, community colleges, MARA colleges and private colleges. This study does not include teacher's training colleges and matriculation colleges, which are registered under the Ministry of Education.
To identify the state of academic computing at Malaysian colleges, a survey was conducted in 2006. Questionnaires and supporting documents were sent to the colleges. For each college, a management representative was asked to complete the survey based on inputs from the ICT and academic departments. The overall participation from colleges was encouraging. During the eight weeks of data collection, 62 colleges completed and returned the survey questionnaires. The types and number of colleges participating in the academic computing survey is given in Table 1.
Table 1: The profile of participating colleges
Types of Colleges |
Public |
Private |
Overall |
MARA Colleges
Community Colleges
Polytechnics
Private Colleges |
9
11
6
- |
-
-
-
36 |
9
11
6
36 |
Overall |
26 |
36 |
62 |
The questionnaire of the survey incorporated 46 questions encompassing the six academic computing areas. The structure of the survey questionnaire is shown in Figure 2. The questionnaire used a form of categorical scales based on the academic computing assessment rubrics (see Appendix A). For each question, clear descriptions characterising the low, moderate and high performance levels were given. Respondents were required to select the option that best characterises the state of academic computing at their respective colleges.
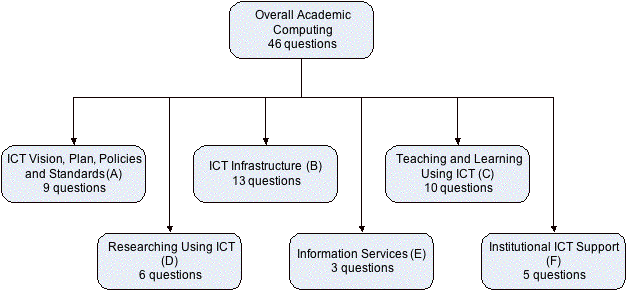
Figure 2: Structure of the survey questionnaire
Cronbach's alpha is the most common form of internal consistency reliability coefficient based on the correlation between variables. Cronbach's alpha coefficient ranges in value from 0.00 to 1.00. If the correlation is high, there is evidence that the questions are measuring the same underlying construct, therefore indicating a reliable scale. There is no set standard regarding the minimum acceptable threshold value of Cronbach's alpha, but Hair et al. (1998) suggest the values of 0.60 to 0.70 to be the lower limit of acceptability. According to Garson (2006), the alpha value should be at least 0.70 to achieve an "adequate" scale and 0.80 to achieve a "good" scale. To determine the reliability of the questionnaire used in this study, Cronbach's alpha values were calculated for the overall academic computing and the six academic computing areas. In general, all alpha values exceeded 0.70, thus indicating the reliability of the questionnaire. The values are shown in Table 2.
Table 2: Reliability of the scale
Construct |
Cronbach's Alpha |
Overall Academic Computing |
0.947 |
ICT Vision, Plan, Policies and Standards (A) |
0.791 |
ICT Infrastructure (B) |
0.848 |
Teaching and Learning Using ICT (C) |
0.886 |
Researching Using ICT (D) |
0.902 |
Information Services (E) |
0.804 |
Institutional ICT Support (F) |
0.735 |
RESULTS
ICT Vision, Plan, Policies and Standards (A)
Figure 3 shows the performance of colleges in relation to the component ICT Vision (A1). In driving the ICT vision (A11), the top management provided leadership at 58% of colleges. As for the rest, the ICT vision was driven by lecturers and/or ICT specialists. The focus of the ICT vision (A12) varied, from the learning of ICT skills and the uses of technology (37%), to ICT infrastructure and the improvement of learning and management (34%), to ICT based learning environment and technology integration (29%). At 65% of colleges, efforts were underway to build greater awareness and understanding of the ICT vision by the campus community (A13).
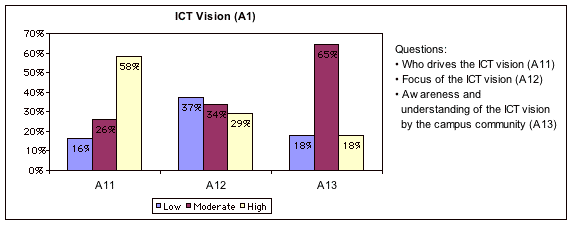
Figure 3: Performance of colleges in relation to ICT Vision (A1)
Figure 4 shows the performance of colleges in relation to the component ICT Plan (A2). At 48% of colleges, the scope of ICT plan (A11) encompassed ICT infrastructure, the use of ICT in teaching and learning and professional development. However, at 34% of colleges, the scope was limited to the acquisition of basic hardware and software. At most colleges, ICT specialists and lecturers participated in the development of the ICT plan (A22). However, only 44% of colleges developed their ICT plan based on the participation and input from the top management and students. In relation to the funding for implementing the ICT plan (A23), a majority of colleges reported either having a limited (50%) or a fair amount of funding (35%).
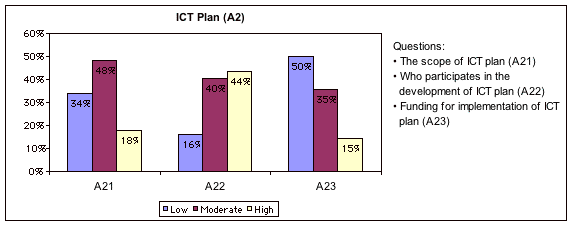
Figure 4: Performance of colleges in relation to ICT Plan (A2)
Figure 5 shows the performance of colleges in relation to the component ICT Policies and Standards (A3). The scope of ICT policies and standards (A31) varied, from the purchasing of equipments and access for students (39%), to the inclusion of information literacy, acceptable use and ethics (37%), and finally to encompass the use of ICT in teaching and learning, copyright and intellectual property, and ICT incentives (24%). Regarding the level of ICT policy development and implementation (A32), 35% of colleges reported having very few ICT policies. At 48% of the colleges, many of the ICT policies were in place, but they were inconsistently implemented. The review of ICT policies and standards (A33) at 44% of colleges were conducted from time to time based on the requests and recommendations of ICT specialists and lecturers. At 32% of colleges, no review was conducted.
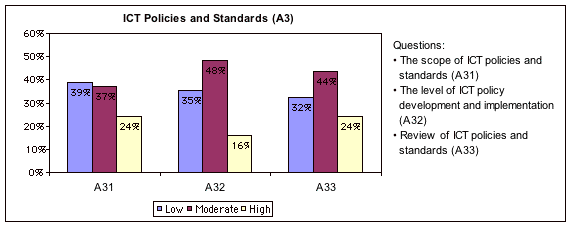
Figure 5: Performance of colleges in relation to ICT Policies and Standards (A3)
ICT Infrastructure (B)
Figure 6 shows the performance of colleges in relation to the component Computers (B1). The ratio of computers to students (B11 and B12) varied quite evenly between low (ratio at 1:9 or less), moderate (ratio between 1:8 and 1:4) and high (ratio at 1:3 or better) performance levels. The ratio of computers to lecturers (B13 and B14) was much better with the majority of colleges reported achieving either moderate (ratio between 1:4 and 1:2) or high (ratio 1:1 or better) performance levels.
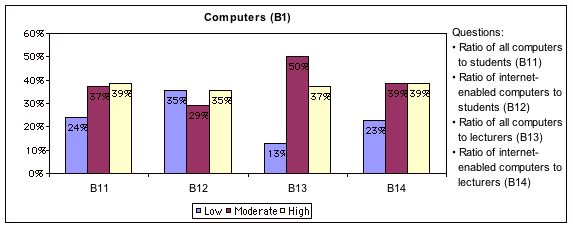
Figure 6: Performance of colleges in relation to Computers (B1)
Figure 7 shows the performance of colleges in relation to the component Network and Internet (B2). At 61% of colleges, the network specification (B21) was 100 MB Ethernet. Only 21% of the colleges employ Gigabit Ethernet technology in their network infrastructure. To access the Internet, most colleges reported having an Internet bandwidth (B22) of 1 MBps or less (45%), or 2 to 7 MBps (44%). Wireless coverage (B23) was low at a majority of colleges, with 63% of the colleges reported having coverage less than 25 percent of the total learning area. As for network performance (B24), 76% of colleges reported having moderate performance: the network and the Internet generally worked well, but they were slow at busy times.
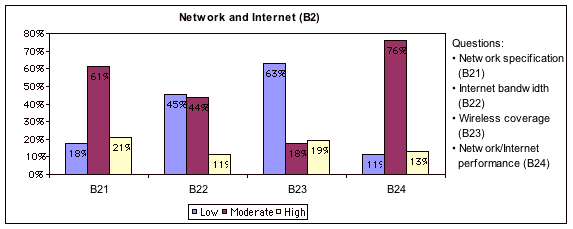
Figure 7: Performance of colleges in relation to Network and Internet (B2)
Figure 8 shows the performance of colleges in relation to the component Display Screen Technologies and Peripherals (B3). At 65% of colleges, less than 25 percent of classrooms were equipped with display screen technologies (B31). Regarding computer peripherals (B32), 63% of colleges reported having printers, scanners, digital cameras, and audio and video recorders. At 24% of the colleges, peripherals were limited to printers. Only 13% of colleges possessed peripherals such as portable devices, specialised devices for research and instructional purposes, and computer conferencing facilities.
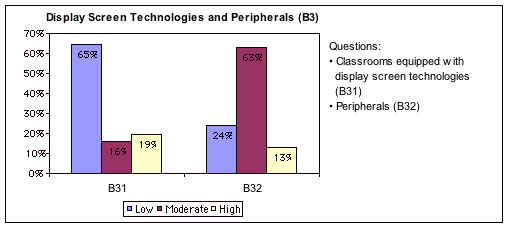
Figure 8: Performance of colleges in relation to Display Screen Technologies and Peripherals (B3)
Figure 9 shows the performance of colleges in relation to the component Software and Information Systems (B4). At 58% of colleges, application software (B41) encompassed office applications, subject specific software, multimedia authoring tools, video and audio production, and web tools. At 32% of colleges, application software was limited to office applications. Only 10% of the colleges possessed specialised software for collaboration, instruction and research. In relation to the learning platform (B42), only 8% of colleges implement a commercial or a customised open source learning management system offering a wide range of functions. As for the rest, no learning platform was available or the learning platform was limited to web pages on the campus Intranet and learning material files stored in public folders on the network. Regarding academic/student information systems (B43), 47% of colleges reported having a system incorporating mainly registration and examination functions. Surprisingly, 35% of colleges still depended on spreadsheets and databases to store academic and student data.
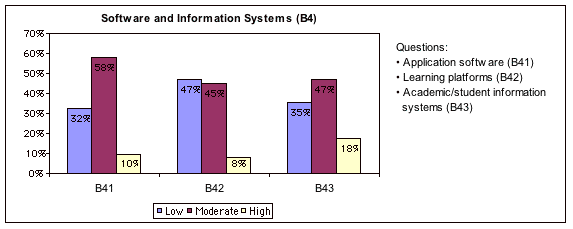
Figure 9: Performance of colleges in relation to Software and Information Systems (B4)
Teaching and Learning Using ICT (C)
Figure 10 shows the performance of colleges in relation to the component E-learning Approaches (C1). In general, the performance levels for e-learning approaches were determined by the percentage of ICT use of courses or lecturers. Three e-learning approaches were more evident at a majority of participating colleges, namely using ICT as a source of information in preparing lesson plans and teaching material (C11), using ICT to support learning (C12) and using ICT in a role similar to traditional classroom tool (C13). Approximately 40% of colleges achieved high performance: the ICT use involved more than 50 percent of courses or lecturers. E-learning approaches such as using ICT in parallel with traditional learning (C14) and using ICT to enable flexible learning (C15) were less evident: colleges achieving high performance were at 19% and 11% respectively.
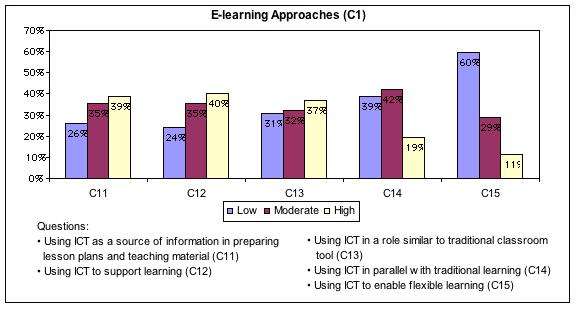
Figure 10: Performance of colleges in relation to E-learning Approaches (C1)
Figure 11 shows the performance of colleges in relation to the component Communication Using ICT (C2). In general, the performance levels in relation to using ICT as a means of academic related communication/discussion were determined by the percentage of ICT use by students and lecturers. As a whole, the use of ICT to facilitate communication between students and lecturers (C21) and between lecturers (C22) was still low. The ICT use involved less than 25% of students and lecturers at about 50% of colleges.
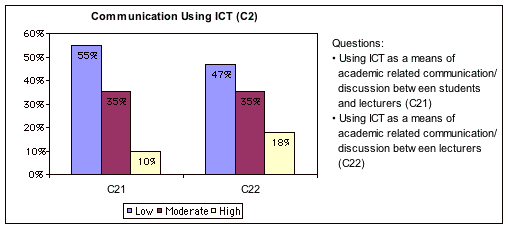
Figure 11: Performance of colleges in relation to Communication Using ICT (C2)
Figure 12 shows the performance of colleges in relation to the component Student Assessment Using ICT (C3). In general, the performance levels were determined by the percentage of ICT use involving courses. As a whole, most colleges reported having low performance in relation to online submission of work (C31), e-portfolio/e-presentation (C32) and online test/examination (C33), with the percentage of low performance exceeding 75% of colleges.
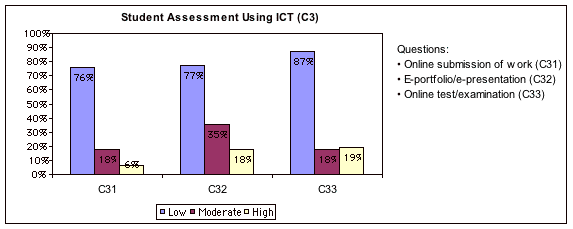
Figure 12: Performance of colleges in relation to Student Assessment Using ICT (C3)
Researching Using ICT (D)
Figure 13 shows the performance of colleges in relation to the component Collecting and Processing Research Data (D1). The analysis is based on 10 colleges that were active in academic research. In relation to using Internet and online resources as source of research information (D11), the performance level was high with 50% of colleges used ICT involving more than 75 percent of research projects. Regarding the use of ICT as a means to collect data (D12), the performance was generally moderate with 50% of colleges use ICT involving 25 to 50 percent of research projects. As for using ICT (computer hardware and software) to process/analyse research data (D13), the performance levels were more evenly distributed between low, moderate and high performance levels.

Figure 13: Performance of colleges in relation to Collecting and Processing Research Data (D1)
Figure 14 shows the performance of colleges in relation to the component Managing and Publishing Research Information (D2). The analysis is based on 10 colleges that were active in academic research. In relation to using ICT to manage and document research projects (D21) and to communicate and collaborate between research project members (D22), a majority of colleges reported having either high or low performance. As for using ICT to share, disseminate and publish research data/findings (D23), the distribution of performance levels was close to normal. 50% of colleges reported having moderate performance: the ICT use involved 50 to 75 percent of research projects.

Figure 14: Performance of colleges in relation to Managing and Publishing Research Information (D2)
Information Services (E)
Figure 15 shows the performance of colleges in relation to the area Information Services (E). In relation to academic/student information accessible online (E11), a majority of colleges reported having low or moderate performance. The institutional website at 40% of colleges provided only a very brief listing of academic programmes being offered. At 39% of colleges, the institutional website provided general academic information such as programme structure and requirements, and description of courses. At 74% of colleges, learning support materials accessible online (E21) involved less than 25 percent of courses. At 69% of colleges, online journals and databases (E22) were very limited and they were accessible only from the library.

Figure 15: Performance of colleges in relation to Information Services (E)
Institutional ICT Support (F)
Figure 16 shows the performance of colleges in relation to the component ICT Skill Development (F1). Regarding the integration of ICT literacy in the curriculum (F11), the performance levels were distributed towards low and moderate performance. 84% of colleges included ICT literacy as a separate unit or course in the curriculum and it was compulsory for some or many of the programmes being offered. Only 16% of colleges made ICT literacy compulsory for all of the programmes being offered. As for ICT skill development for lecturers (F12), only 21% of colleges successfully achieved high performance, involving more than 75 percent of lecturers.

Figure 16: Performance of colleges in relation to Institutional ICT Support (F1)
Figure 17 shows the performance of colleges in relation to the component Technical ICT Support (F2). The ratio of technical ICT support staff to computer labs/areas (F21) was at 1:6 or less at 58% of colleges. Regarding the efficiency of technical ICT support (F22), ICT tasks and problems were seldom or not always resolved in a timely and efficient manner at 73% of colleges. 27% of colleges successfully achieved high performance: ICT tasks and problems were always resolved in a timely and efficient manner.

Figure 17: Performance of colleges in relation to Technical ICT Support (F2)
As for the scope of technical ICT assistance (F23), 45% of colleges reported having moderate performance: ongoing support for ICT users was readily available, but it was limited to resolving hardware problems, software installations, and general ICT use in common applications. However, only 21% of colleges successfully achieved high performance: ongoing support for ICT users was readily available, encompassing hardware, software, general ICT use, and specific ICT development and use in teaching, learning and research environment.
CONCLUSION
ICT vision, plan, policies and standards provided direction and a basis for decision-making in relation to academic computing at Malaysian colleges. An increasing number of the top management were involved in the development of ICT policy and strategy and provided leadership in driving academic computing initiatives. Throughout the colleges, efforts were underway to build greater awareness and understanding of the ICT vision by the campus community. The focus was changing towards the improvement of learning processes and management. The funding for implementing the ICT plan varied between colleges. However, only a small number of colleges reported having significant funding.
The extent of ICT infrastructure at Malaysian colleges indicated the level of capacity and sophistication in promoting more accessibility to technologies and in supporting the core areas of higher education. The availability of computers for students varied between low, moderate and high performance levels. However, the availability of computers for lecturers was much better, with ratios indicating moderate and high performance. The network infrastructure generally worked well, but they were slow at busy times. Wireless network was still in its infancy with limited coverage at most colleges. While a majority of colleges reported using academic/student information systems to manage academic processes, the use of learning management systems was still not widespread.
In relation to teaching and learning, ICT was more commonly used as a source of information, to support learning and in a role similar to traditional classroom tool. E-learning approaches such as using ICT in parallel with traditional learning and using ICT to enable flexible learning were less evident at Malaysian colleges. The use of ICT to facilitate communication between students and lecturers, and between lecturers was still not widespread at many colleges.As for the use of ICT in student assessment, the practice was almost non-existent at most colleges. Regarding the use of ICT to facilitate research, less than 20% of the Malaysian colleges in the study were actively involved in academic research. Therefore, due to the small sample, it was difficult to generalise the findings. However, it was clear from the analysis that certain colleges displayed high performance in relation to the use of ICT in research. At some colleges, the performance was moderate while the performance was low at other colleges.
ICT-based information services at Malaysian colleges were very important due to the fact that they were important producers of information and knowledge. However, such services were clearly lacking. Information on academic programmes and courses were limited. Learning support materials were still scarce and access to online journals and databases was very limited. To develop ICT skills for students, ICT literacy courses have been included in the curriculum at most colleges. ICT training was also given to lecturers, although it involved only a certain groups of lecturers. There were also insufficient technical support services to maintain the computer labs at a number of the colleges. In addition, the scope of ICT support was limited to resolving hardware problems, implementing software installations and assisting users on general ICT use in common applications.
As ICT plays an important role in driving the Malaysian higher education towards excellence and in achieving Malaysia's aspiration to be a fully developed nation, it is interesting to see how academic computing performance at Malaysian colleges compares with the performance of colleges in a developed nation. In this study, the academic computing performance of colleges in the United Kingdom (UK) is used as a benchmark. A report entitled "ICT and e-learning in further education: management, learning and improvement" (Becta, 2006) describes ICT implementation at UK colleges. The report encompasses all academic computing areas except researching using ICT and involves approximately half of the questions from the Malaysia survey questionnaire. The Malaysia-UK comparison is summarised in Table 3. In general, a lower percentage of Malaysian colleges successfully achieved moderate or high academic computing performance levels compared with their UK counterparts. The largest differences of performance were related to ICT vision plan, policies and standards, ICT infrastructure and institutional ICT support.
Implementing academic computing is a long and expensive process. It may take many years for Malaysian colleges to be successful and to be on par with colleges in developed countries. Although funding is an important factor, many other factors must be taken into account before and during the implementation of academic computing initiatives. Failure to address important issues may result in wasted resources and ineffective implementation. Due to the high costs of investment, it is important for Malaysian colleges to be selective and undertake academic computing initiatives that give the most return. Serious consideration must be given to ensure quick adoption of academic computing and later sustain it once it is adopted.
Based on the study, it can be said that a majority of colleges in Malaysia were implementing some aspects of academic computing. As for the future of academic computing, the potential for growth at large colleges, with significant funding, purpose-built campuses with state-of-the-art teaching-learning and research facilities, is generally good. However, it is difficult to see the smaller colleges, housed at shop lots with limited facilities, to invest much in academic computing. These colleges normally charge a lower fee due to the lack of infrastructure and attract a smaller number of students, many of them from the lower income families. As long as the smaller colleges exist, and without the support of the government, there will always be a digital divide between the large and the small colleges in Malaysia. Although academic computing has the potential to drive higher education in Malaysia towards excellence, it may also create the problem of equity between the rich and the poor in Malaysia.
As for future research, this study can be extended to include other types of colleges such as teacher's training college and matriculation colleges, as well as university type higher education institutions in Malaysia. A comparison between different types of institutions would help identify academic computing trends and would give a more comprehensive picture of academic computing in Malaysian higher education.
Table 3: Comparison of academic computing performances in Malaysia and the United Kingdom
Item of comparison |
Related question |
% of colleges |
Malaysia |
UK* |
ICT Vision, Plan, Policies and Standards |
|
|
|
Participation by the top management in driving the ICT initiatives |
A11 |
58% |
85% |
E-learning in the ICT strategy/plan |
A21 |
56% |
97% |
Regular review of ICT strategy/policy |
A33 |
24% |
86% |
ICT Infrastructure |
|
|
|
Ratio of computers to students (1:8 or better) |
B11, B12 |
76% |
93% |
Ratio of computers to lecturers (1:1 or better) |
B13, B14 |
37% |
Mean ratio
at 1:1 |
Gigabit Ethernet for network |
B21 |
21% |
73% |
Internet bandwidth 2 MBps or greater |
B22 |
56% |
100% |
Substantial wireless coverage |
B23 |
19% |
12% |
Smooth network performance |
B24 |
13% |
61% |
Substantial display screen facilities in classrooms |
B31 |
19% |
33% |
Learning management systems |
B42 |
8% |
82% |
Teaching and Learning Using ICT |
|
|
|
Widespread use of ICT to support learning |
C12 |
40% |
52% |
Widespread ICT use as a traditional classroom tool |
C13 |
37% |
34% |
Widespread ICT use in parallel with traditional learning |
C14 |
19% |
31% |
Widespread ICT use to enable flexible learning |
C15 |
11% |
25% |
Widespread ICT use to facilitate communication between lecturers and students |
C21 |
10% |
25% |
Widespread online submission of work |
C31 |
6% |
9% |
Widespread online test/examination |
C33 |
19% |
9% |
Information Services |
|
|
|
The use of ICT to disseminate academic information |
E11 |
60% |
72% |
Substantial learning material accessible online |
E21 |
8% |
34% |
Institutional ICT Support |
|
|
|
ICT skills development for students |
F11 |
84% |
85% |
ICT skills development for lecturers |
F12 |
21% |
99% |
Support for ICT development in teaching-learning |
F23 |
21% |
68% |
* Source: Becta (2006)
REFERENCES
Becta (2006). ICT and e-learning in further education: management, learning and improvement, a report on the further education sector's engagement with technology. Coventry: Becta.
Carleton College (1991). A Case for Change. Report of the Task on Academic Computing [online]. Available from: http://www.carleton.ca/cu/reports/ TFACReport.pdf [Accessed 15 January 2005].
Cooper, P.A. (1991). Examining the Role of Director of Academic Computing. Consortium for Computing in Small College. SCSCCC-91, 18-27.
Ferrer, D. and Corya, W. (1990). The Twain Shall Meet: Libraries Meet Academic Computing Centers. ACM SIGUCCS, 18, 121-125.
Gan, S. L. (2001). IT & Education in Malaysia: Problems, Issues and Challenges. Petaling Jaya: Pearson Education Malaysia.
Garson, G. D. (2006). Reliability Analysis [online]. Available from: http://www2.chass.ncsu.edu/garson/pa765/reliab.htm [Accessed 15 July 2006].
Hair, J. E., Anderson, R. E., Tatham, R. L. and Black, W. C. (1998). Multivariate Data Analysis. 5th Edition. New Jersey: Prentice-Hall.
International Standards Organisation (1998). ISO 11620: Information and Documentation - Library Performance Indicators. Geneva: International Standards Organisation.
Lumby, J. (2001). Managing Further Education: Learning Enterprise. London: Paul Chapman Publishing.
Ministry of Higher Education Malaysia (2006). Report by the Committee to Study, Review and Make Recommendations Concerning the Development and Direction of Higher Education in Malaysia.
Mokhtar, S. A., Alias, R. A. and Abdul Rahman, A. (2006). Assessing Academic Computing in Malaysian Higher Education: A Value Chain Approach. Journal of Institutional Research South East Asia, 4 (12), 59-92.
Nielsen, B., Steffen, S. S. and Dougherty, M. C. (1995). Computing Center/Library Cooperation in the Development of a Major College Service: Northwestern's Electronic Reserve System. Realizing the Potential of Information Resources: Information, Technology,and Services--Proceedings of the 1995 CAUSE Annual Conference. 1995. Boulder, Colorado: CAUSE, 8-5-1 - 8-5-8.
Nuttall, D. L. (1994). Choosing Indicators. In: Riley, K. A. and Nuttall, D. L. Measuring Quality: Education Indicators – United Kingdom and International Perspectives. London: The Falmer Press. 17-40; 1994.
Pickett, N. (1998). Creating Rubrics [online]. Available from: http://teacher.esuhsd.org/rubrics/ [Accessed 9 February 2006].
Porter, M. E. (1985). Competitive Advantage. New York: Free Press.
Prupis, S. L., 1989. Evaluating Academic Computing on Campus and Developing a 5-Year Plan. ACM SIGUCCS, 17, 83-87.
UNESCO (2004). ICT Policies of Asia Pacific [online]. Available from: http://www.unescobkk.org/education/ict/v2/info.asp?id=15898 [Accessed 15 August 2004].
Van Valey, T. L. and Poole, H. (1994). Surveys of Computing: A Tool for Campus Planning. ACM SIGUCCS, 22, 105-110.
APPENDIX A
Table A1: Rubric for ICT Vision, Plan, Policies and Standards (A)
ICT Vision (A1) |
Levels of Performance |
Low |
Moderate |
High |
Who drives the ICT vision (A11) |
Driven by enthusiastic lecturers. |
Driven by ICT specialists and lecturers. |
Driven by the top management by providing leadership. |
Focus of the ICT vision (A12) |
Focus on the learning of ICT skills and the uses of technology. |
Focus on the infrastructure and improvement of learning and the management of learning. |
Focus on ICT based learning environment based on ICT and technology integration. |
Awareness and understanding of the ICT vision by the campus community (A13) |
Generally unaware of any ICT vision. |
Efforts are underway to build greater awareness and understanding |
Good awareness and are well informed. |
ICT Plan (A2) |
Levels of Performance |
Low |
Moderate |
High |
The scope of ICT plan (A21) |
Limited to the acquisition of basic hardware and software. |
Encompasses infrastructure, the use of ICT in teaching and learning and professional development. |
Encompasses infrastructure, the use of ICT in teaching, learning and research, professional development and support. |
Who participates in the development of ICT plan (A22) |
Developed by ICT specialists. |
ICT specialists and lecturers contribute to the development of the plan. |
Developed with participation from the top management, lecturers, staff and students. |
Funding for implementation of ICT plan (A23) |
Limited amount. |
Fair amount. |
Significant amount. |
ICT Policies and Standards (A3) |
Levels of Performance |
Low |
Moderate |
High |
The scope of ICT policies and standards (A31) |
Confined to the purchasing of equipments and access for learners. |
Encompasses infrastructure, learner access, information literacy, acceptable use and ethics. |
Encompasses infrastructure, learner access, information literacy, teaching and learning, acceptable use, ethics, copyright, intellectual property and incentives. |
The level of ICT policy development and implementation (A32) |
Very few are in place. |
Many are in place, but are inconsistently implemented. |
Many are in place and consistently implemented. |
Review of ICT policies and standards (A33) |
None. |
Reviewed from time to time based on requests and recommendations of ICT specialists and lecturers. |
Reviewed regularly based on the recommendations and feedback from ICT specialists, lecturers and students. |
Source: Mokhtar et al. (2006)
Table A2: Rubric for ICT Infrastructure (B)
Computers (B1) |
Levels of Performance |
Low |
Moderate |
High |
Ratio of all computers to students (B11) |
1:9+ |
1:8 to 1:4 |
1:3 or better |
Ratio of internet-enabled computers to students (B12) |
1:9+ |
1:8 to 1:4 |
1:3 or better |
Ratio of all computers to lecturers (B13) |
1:5+ |
1:2 to 1:4 |
1:1 or better |
Ratio of internet-enabled computers to lecturers (B14) |
1:5+ |
1:2 to 1:4 |
1:1 or better |
Network and Internet (B2) |
Levels of Performance |
Low |
Moderate |
High |
Network specification (B21) |
10 MB Ethernet or less. |
100 MB Ethernet. |
Gigabit Ethernet or better. |
Internet bandwidth (B22) |
Dialup or broadband up to 1 MBps. |
Broadband, 2 to 7 MBps. |
Broadband, 8 MBps or better. |
Wireless coverage (B23) |
Less than 25% of learning area. |
25% to 50% of learning area. |
More than 50% of learning area. |
Network/Internet performance (B24) |
Slowness/unreliability a frequent problem. |
Generally works well, but slow at busy times. |
Always smooth without appreciable delay. |
Display Screen Technologies and Peripherals (B3) |
Levels of Performance |
Low |
Moderate |
High |
Classrooms equipped with display screen technologies (B31) |
Less than 25% of classrooms. |
25% to 50% of classrooms. |
More than 50% of classrooms. |
Peripherals (B32) |
Mostly printers. |
Printers and other peripherals such as scanners, digital cameras and audio/video recorders. |
A wide range of peripherals such as printers, scanners, digital cameras, audio/video recorders, portable devices, specialised devices for research and instructional purposes, computer conferencing facilities. |
Software and Information Systems (B4) |
Levels of Performance |
Low |
Moderate |
High |
Application software (B41) |
Office applications (word processing, spreadsheets, databases and presentation software). |
Office applications, subject specific software, multimedia authoring and video/audio production, web tools. |
Office applications, subject specific software, multimedia authoring and video/audio production, web tools, collaborative and conferencing, and specialised software for instruction and research. |
Learning platforms (B42) |
None available. |
Web pages on campus Intranet and learning material files stored in public folders on network. |
Commercial or customised open source learning management system offering a wide range of functions. |
Academic/student information systems (B43) |
Academic/student data are stored mainly in spreadsheets and databases. |
Academic/student information systems are limited to mainly registration and examination functions. Access is largely limited to administrative staff. |
Academic/student information systems encompass a variety of academic/student functions. Some of the functions have become paperless. Specific functions can be access by staff and students from the Intranet/Internet. |
Source: Mokhtar et al. (2006)
Table A3: Rubric for Teaching and Learning Using ICT (C)
E-learning Approaches (C1) |
Levels of Performance |
Low |
Moderate |
High |
Using ICT as a source of information in preparing lesson plans and teaching material (C11) |
ICT use involves less than 25% of courses/lecturers. |
ICT use involves 25% to 50% of courses/lecturers. |
ICT use involves more than 50% of courses/lecturers. |
Using ICT to support learning (C12) |
Infrequent ICT use (once a month or less) and it involves less than 25% of courses/ lecturers. |
Regular ICT use (once every two weeks) and it involves 25% to 50% of courses/lecturers. |
Frequent ICT use (once a week) and it involves more than 50% of courses/lecturers. |
Using ICT in a role similar to traditional classroom tool (C13) |
Infrequent ICT use (once a month or less) and it involves less than 25% of courses/ lecturers. |
Regular ICT use (once every two weeks) and it involves 25% to 50% of courses/lecturers. |
Frequent ICT use (once a week) and it involves more than 50% of courses/lecturers. |
Using ICT in parallel with traditional learning (C14) |
ICT use involves less than 25% of courses/ lecturers. |
ICT use involves 25% to 50% of courses/ lecturers. |
ICT use involves more than 50% of courses/ lecturers. |
Using ICT to enable flexible learning (C15) |
ICT use (at least for specific modules) involves less than 25% of courses. |
ICT use (at least for specific modules) involves 25% to 50% of courses. |
ICT use (at least for specific modules) involves more than 50% of courses. |
Communication Using ICT (C2) |
Levels of Performance |
Low |
Moderate |
High |
Using ICT as a means of academic related comm./ discussion between students and lecturers (C21) |
ICT use involves less than 25% of students/ lecturers. |
ICT use involves 25% to 50% of students/ lecturers. |
ICT use involves more than 50% of students/ lecturers. |
Using ICT as a means of academic related communication/discussion between lecturers (C22) |
ICT use involves less than 25% of lecturers. |
ICT use involves 25% to 50% of lecturers. |
ICT use involves more than 50% of lecturers. |
Student Assessment Using ICT (C3) |
Levels of Performance |
Low |
Moderate |
High |
Online submission of work (C31) |
ICT involves less than 25% of courses. |
ICT involves 25% to 50% of courses. |
ICT use involves more than 50% of courses. |
E-portfolio/e-presentation (C32) |
ICT involves less than 25% of courses. |
ICT involves 25% to 50% of courses. |
ICT use involves more than 50% of courses. |
Online test/examination (C33) |
ICT involves less than 25% of courses. |
ICT involves 25% to 50% of courses. |
ICT use involves more than 50% of courses. |
Source: Mokhtar et al. (2006)
Table A4: Rubric for Researching Using ICT (D)
Collecting and Processing Research Data (D1) |
Levels of Performance |
Low |
Moderate |
High |
Using Internet and online resources as source of research information (D11) |
ICT involves less than 50% of research projects. |
ICT involves 50% to 75% of research projects. |
ICT use involves more than 75% of research projects. |
Using ICT as a means to collect data (D12) |
ICT involves less than 25% of research projects. |
ICT involves 25% to 50% of research projects. |
ICT use involves more than 50% of research projects. |
Using ICT (computer hardware and software) to process/analyse research data (D13) |
ICT involves less than 50% of research projects. |
ICT involves 50% to 75% of research projects. |
ICT use involves more than 75% of research projects. |
Managing and Publishing Research Information (D2) |
Levels of Performance |
Low |
Moderate |
High |
Using ICT to manage and document research projects (D21) |
ICT involves less than 50% of research projects. |
ICT involves 50% to 75% of research projects. |
ICT use involves more than 75% of research projects. |
Using ICT to communicate and collaborate between research project members (D22) |
ICT involves less than 25% of research projects. |
ICT involves 25% to 50% of research projects. |
ICT use involves more than 50% of research projects. |
Using ICT to share, disseminate and publish research data/findings (D23) |
ICT involves less than 50% of research projects. |
ICT involves 50% to 75% of research projects. |
ICT use involves more than 75% of research projects. |
Source: Mokhtar et al. (2006)
Table A5: Rubric for Information Services (E)
Academic Information (E1) |
Levels of Performance |
Low |
Moderate |
High |
Academic/student information accessible online (E11) |
Institutional website provides only a very brief listing of academic programmes on offer. |
Institutional website provides general academic information such as programme structure and requirements, and description of courses. |
Institutional website provides a wide variety of information, including a detail description of programmes and courses, as well as other academic/ student related information such as academic calendars, activities and announcements. |
Learning Materials and References (E2) |
Levels of Performance |
Low |
Moderate |
High |
Learning support materials accessible online (E21) |
Learning support materials accessible online involve less than 25% of courses. |
Learning support materials accessible online involve 25% to 50% of courses. |
Learning support materials accessible online involve more than 50% of courses. |
Online journals/databases (E22) |
Access to online journals and databases is very limited and they are accessible only from the library. |
Access to online journals and databases covers many related fields of study and they are accessible from the library and certain computers within campus. |
Access to online journals and databases covers all related fields of study and they are sufficiently accessible by staff and students from within and outside campus. |
Source: Mokhtar et al. (2006)
Table A6: Rubric for Institutional ICT Support (F)
ICT Skill Development (F1) |
Levels of Performance |
Low |
Moderate |
High |
Integration of ICT literacy in the curriculum (F11) |
ICT literacy is included as a separate unit/ course in the curriculum and is compulsory for some of the programmes being offered. |
ICT literacy is included as a separate unit/ course in the curriculum and is compulsory for many of the programmes being offered. |
ICT literacy is included as a separate unit/ course in the curriculum and is compulsory for all of the programmes being offered. |
ICT skill development for lecturers (F12) |
ICT skill development involves less than 25% of lecturers. |
ICT skill development involves 25% to 75% of lecturers. |
ICT skill development involves more than 75% of lecturers. |
Technical ICT Support (F2) |
Levels of Performance |
Low |
Moderate |
High |
Ratio of technical ICT support staff to computer labs/areas (F21) |
1:6+ |
1:3 to 1:5 |
1:2 or better |
Efficiency of technical ICT support (F22) |
ICT tasks and problems are seldom resolved in a timely and efficient manner. |
ICT tasks and problems are not always resolved in a timely and efficient manner. |
ICT tasks and problems are always resolved in a timely and efficient manner. |
Scope of technical ICT assistance (F23) |
Support for ICT users is available when requested, but limited to resolving hardware problems and software installations. |
Ongoing support for ICT users is readily available, limited to resolving hardware problems, software installations and the general ICT use in common applications. |
Ongoing support for ICT users is readily available, encompassing hardware, software, general ICT use and specific ICT development/use in teaching-learning and research environment. |
Source: Mokhtar et al. (2006)
Copyright for articles published in this journal is retained by the authors, with first publication rights granted to the journal. By virtue of their appearance in this open access journal, articles are free to use, with proper attribution, in educational and other non-commercial settings.
Original article at: http://ijedict.dec.uwi.edu//viewarticle.php?id=312&layout=html
|