Construct validation of ICT Indicators Measurement Scale (ICTIMS)
Yavuz Akbulut, Mehmet Kesim and Ferhan Odabasi
Anadolu University, Turkey
ABSTRACT
This study aims to analyze psychometric features of a scale which was developed to measure indicators of Information and Communication Technologies (ICTs) at an undergraduate institution in Turkey. Issues forming successful ICT integration were identified according to competencies stated by UNESCO (2002). Besides, each competency sheltered further sub-components which were adapted from UNESCO (2002) and Odabasi et al. (2006). Questionnaire items for each factor were prepared and verified through expert panels. The questionnaire was administered to 359 education college students at a Turkish state university. Exploratory factor analysis eliminated 13 of 54 questions in the scale, identified 10 factors accounting for 51.557 % of the variance. The internal consistency was also high (a=.888). Then a confirmatory factor analysis was conducted which eliminated three more questions and revealed an ideal model fit. The model summary of the confirmatory factor analysis was provided along with implications and suggestions for further research.
Keywords: ICT indicators; Teacher training; ICT Indicators Measurement Scale (ICTIMS)
INTRODUCTION
Skills regarding information and communication technologies (ICTs) have gained utmost importance for education, for employment and for everyday life use in the 21st century. The ability to use ICTs with confidence and efficiency is demanded from most employers. As also reported by the Commission of the European Communities (2002), ICTs are used as tools for both learning activities and learning assistance, which place them into a well-established status in current education and training systems, that is, ICTs are crucial in the context of lifelong learning. This presents an enormous challenge to educators since they are expected to equip students with relevant, up-to-date and high-quality ICT experience before students emerge into the employment world (Gibson, O'Reilly, & Hughes, 2002). In this respect, ICT competencies of undergraduate students who will take the leading role in shaping the society of the future are to be investigated with scrutiny. According to a recent survey named Survey of European Universities Skills in ICT of Students and Staff ICT (SEUSISS), to which 13.000 students, staff and employers across Europe responded, ICTs were considered vital for future professional endeavors by the majority of participants (Haywood, 2003).
Researchers have studied several factors that could affect how individuals use ICTs in their personnel and professional endeavors. However, use of ICTs efficiently has been realized only recently. Up to the last decade, ICT supported instruction meant practitioners' conversion of conventional lecture notes to static documents that are made available on the web (Gibson et al., 2002). This is because the change imposed by ICTs is difficult to realize. ICTs present a dilemma for educational institutions for they require transforming new applications into current practices. Moreover, it is not easy to see through the short-term problems exerted by ICTs to understand how ICTs could transform education in the long-run (Richards, 2004).
Billig, Sherry and Havelock (2005) examine the factors that facilitate and support educators' uses of technology. Factors they mentioned could be applied to technology integration endeavors as well. Based on the Billig (2002) study, which surveyed leaders of 17 organizations that could sustain educational innovations for a long time, Billig et al. (2005) claim that the followings are necessary for educational initiatives to be successful and sustainable: Strong leadership that promotes a shared vision, strong infrastructure that stress human autonomy, well-organized support structures for professional development, incentives for encouraging practitioners to work for the system and to remain in the system, visibility, credibility, strong and mutually beneficial partnerships, macro-culture development to promote contextual relevance, and sufficient funds from multiple sources. Billig et al. (2005) further list the factors associated with sustainability and institutionalization of innovative endeavors as (a) leadership and identifiable champions to sustain change, (b) infrastructure for technical support and collaborative learning, (c) resource allocation and stable funding, (d) supportive culture and climate, and (e) individual and system incentives, tangible evidence of success, visibility, and empowered networks.
Successful ICT integration is never realized out of a sudden. Teacher training in ICTs and through ICTs constitute a tiresome process from inception stages to maturity. Toledo (2005) scrutinized on three teacher education programs to investigate the stages of ICT integration that are experienced in educational institutions. A thorough triangulation of key informant and focus group interview data, and data from four survey instruments administered to faculty members, administrators, and key informants revealed a five-stage model of technology integration into the teacher training curriculum, namely, pre-integration, transition, development, expansion, and system-wide integration.
Jung (2005) examines four ICT use approaches found in teacher training, and suggests that ICTs can change the ways teacher teach. The first approach considers ICT use as the main training content, which leads teachers to learn how to use ICT tools in the classroom. That is, the approach emphasizes the development of basic ICT skills. The second approach considers ICT use as a part of teaching methods to facilitate teaching where teachers are provided with examples of ICT pedagogy integration in their training, and are allowed to reflect on examples and experiences provided by the curriculum. The third approach considers ICT as core technology for delivering teacher training, that is, ICT is used as the major way of providing teacher training. In the fourth approach, ICT is used to facilitate professional development and networking which could be very effective as long as constant and relevant support is provided. All approaches might have invaluable advantages if applied in an organized and efficient way.
In order to mediate the ICT integration process, teacher perspectives on integrating ICTs into instruction have been well-documented qualitatively through comprehensive studies like the Toledo (2005) study mentioned above. The study conducted by Hennessy, Ruthven, and Brindley (2005) also examined how teachers begin to integrate ICTs into mainstream classroom practice through several focus group interviews with teachers of core subjects like mathematics, science and English. Findings imply that teachers need to develop and endeavor new strategies for mediating ICT supported learning activities.
Smith and Robinson (2003) provide a different perspective for technology integration into curriculum, and suggest that collaborative cohorts be used for successful integration. The suggestion is for preK-12 schools; however, it seems plausible for most educational institutions. They propose creating an environment where teacher educators, pre-service education faculty students, and teachers can learn together through collaborative cohorts.
Since ICTs in teacher education constitute a dynamic field of study, which requires constant refreshment, there is always a need to measure up-to-date latent constructs of ICTs through valid and reliable tools including high quality indicators. Lin (2005) developed a questionnaire to determine technology integration factors that are considered important by teachers. The study offers a reliable measurement of indicators for the assessment of teachers' perception about technology integration. Liu and Huang (2005) also investigated the concerns of teachers about technology integration through well-designed measurement tools. In Turkey, Akpinar (2003) developed and administered a scale to diagnose K-12 teachers' technology using behaviors. The current study has a different scope from these studies for it purports to develop a measurement tool for diagnosing the overall picture of an institution regarding internal and external ICT indicators from prospective teachers' points of view. Issues constituting successful ICT integration were determined according to four competencies stated by UNESCO (2002), namely (a) content and pedagogy issues, (b) collaboration and networking issues, (c) social and health issues, and (d) technical issues each sheltering further subtitles. Subcomponents of four competencies were determined according to UNESCO (2002) and Odabasi et al. (2006). Four competencies and their subcomponents are discussed below.
Content and Pedagogy is considered the most important aspect of infusing technology in the classroom (UNESCO, 2002). Teachers should be equipped with pedagogical competencies to integrate technology into the curriculum, so that they could efficiently create the vital link among their individual approach, the local context and the subject matter knowledge. Odabasi et al. (2006) identifies two subcomponents within this competency, namely, (a) teaching-learning method and (b) ICT in curriculum context. These competencies help teachers to demonstrate a thorough understanding of the opportunities of ICTs in curriculum context, and to implement and evaluate instruction in open and flexible environments (UNESCO, 2002).
Collaboration and Networking suggests that teachers be equipped with skills to facilitate collaboration and networking with both local and global communities, which expands learning beyond the classroom setting. This situation asks teachers to be open-minded and respectful for diversity, so that they could promote democratic learning. Odabasi et al. (2006) examines (a) professional development and (b) learning communities under this construct. These competencies help teachers to demonstrate an understanding of diverse instructional networks within and among communities, participate effectively in flexible learning environments, and prepare and provide equal learning opportunities for a diverse student body (UNESCO, 2002). Besides, professional development implies that teachers benefit from any opportunities to ameliorate their personal and professional competencies.
Social and Health Issues constitutes another set of competencies which asks teachers to understand social, moral, and legal issues surrounding ICTs. Odabasi et al. (2006) lists subcomponents of this construct as (a) health, (b) special needs, (c) ethics, and (d) policy. These issues suggest that teachers understand and apply moral and legal codes of practice, respect for intellectual property, plan and promote healthy use of ICTs for learners including handicapped individuals, and reflect upon and moderate the influence of ICTs on society (UNESCO, 2002).
Technical Issues constitute the technical competencies, issues regarding technical infrastructure, and provision of technical support throughout the curriculum (UNESCO, 2002). Odabasi et al. (2006) mentions four subcategories related to technical issues which are (a) infrastructure, (b) ease of use, (c) access, and (d) technical assistance. These competencies ask teachers to use and select form a variety of ICT resources to improve personal and individual effectiveness and update their skills in the light of new developments (UNESCO, 2002). The UNESCO description of technical issues implies the characteristics of professional development. However, the current study examines professional development issues under the title of collaboration and networking as suggested by Odabasi et al. (2006). The exact categorization of competencies is open to scrutiny through further research.
Above constructs place responsibilities not only upon teachers but also on students and administrative staff. It is not plausible to expect all above competencies from a K-12 teacher whose ICT competencies and endeavors will probably be affected by both internal and external factors. Thus, while realizing a successful ICT integration in teacher training, some competencies mentioned here are considered interrelated with many other factors such as students and administrators. The measurement tool described in the following section clearly reflects some of these interrelations among shareholders of ICT integration and tries to address the following research question: What are the valid and reliable indicators to diagnose the overall ICT picture of an educational institution and its members from prospective teachers' perspectives?
METHODS AND PROCEDURES
Participants
The reference population was senior students of the Faculty of Education at Anadolu University, Turkey. There were 851 students enrolled in the faculty at the time of data collection (i.e., 1st and 2nd weeks of December 2006). Senior students were purposefully selected as they were teacher candidates who were about to complete their education and emerge into the employment world. Participation was realized on a voluntary basis. Researchers delivered 500 copies of the questionnaire 359 of which returned without missing values in critical variables. Number of returning questionnaires constituted 42.19 % of the senior student population. Data collection was mostly realized through randomly selecting from multiple senior classes. However, some departments had either very few students at the senior level or they offered senior courses within the same class. Thus, the current sample reflected the characteristics of an opportunity sample as well.
The profile of the participants is provided in Table 1.
Table 1.Demographic backgrounds of participants
DEPARTMENT |
|
AGE
(Mean: 21.96, SD: 1.93) |
TOTAL |
GENDER |
20 |
21 |
22 |
23 |
>24 |
f |
f |
f |
f |
f |
Foreign Language Education |
Male |
1 |
7 |
10 |
6 |
3 |
27 |
Female |
1 |
30 |
26 |
12 |
6 |
75 |
Computer Education |
Male |
0 |
5 |
15 |
3 |
2 |
25 |
Female |
2 |
4 |
2 |
1 |
0 |
9 |
Primary Education |
Male |
6 |
7 |
7 |
3 |
1 |
24 |
Female |
7 |
21 |
22 |
1 |
2 |
53 |
Special Education |
Male |
1 |
3 |
4 |
4 |
3 |
15 |
Female |
4 |
22 |
13 |
3 |
11 |
53 |
Pre-School Education |
Male |
1 |
0 |
1 |
0 |
1 |
3 |
Female |
25 |
0 |
16 |
1 |
4 |
46 |
Fine Arts Education |
Male |
0 |
2 |
3 |
2 |
5 |
12 |
Female |
1 |
5 |
5 |
3 |
3 |
17 |
TOTAL |
Male |
9 |
24 |
40 |
18 |
15 |
106 |
Female |
40 |
82 |
84 |
21 |
26 |
253 |
N=359
Since a detailed distribution of 11 departments is not needed for further parametric tests in the present study, frequencies of the department variable were summarized. Departments of English Language Teaching, French Language Teaching, and German Language Teaching were combined under the title of Foreign Language Education. Next, Departments of Primary School Education, Primary School Social Studies Teaching and Primary School Mathematics Teaching were combined under the title of Primary Education. Finally, Education of the Mentally Disabled and Education of the Hearing Impaired were combined under the title of Special Education.
Instrument
The instrument reported in the current study was developed in Turkish. A personal information form was administered to collect the independent variables needed for further analyses. Students' age, gender, department, family income, and PC and Internet experiences were elaborated through questions given on this part. While preparing the personal information form, the SEUSISS questionnaire was taken into account (Haywood, 2003). Based on the review of literature, particularly the studies of UNESCO (2002) and Odabasi et al. (2006), six to ten statements for each competencies and sub-competencies were prepared. Eight of the statements were adapted from Akpinar (2003) and three statements were adapted from Demiraslan and Usluel (2005). Statements were examined in the doctorate seminar course of the Department of Computer Education and Instructional Technologies at Anadolu University by the course instructor, who is an expert in the field, and eight PhD candidates. Modifications on the instrument were discussed in two sessions with the group on April 25 and May 9, 2006. Further expert opinions were provided by two academicians who had published test development articles in international peer-reviewed journals, one ICT faculty at Anadolu University, one measurement and evaluation instructor at Anadolu University, the chair of a human subjects committee at a Turkish state university, two PhD students of quantitative measurement and evaluation, and two PhD candidates at the Department of Computer Education and Instructional Technologies. These evaluations reduced the number of statements to 54. Fifteen of these statements were reverse coded so that students would not see a monotonous pattern to respond. Statements were prepared as Likert-Scale items. The frequency of a given statement was evaluated on 5-item scales: Never, rarely, sometimes, very often and always referred to 1, 2, 3, 4, and 5 respectively. The scale was named as the ICT Indicators Measurement Scale (ICTIMS).
Procedure
Written permissions from the rectorate and the human subjects committee of the institution were ready by December 1, 2006. The students were administered the survey during their normal class periods at the 10th and 11th weeks of the 2006 fall semester. The first author administered questionnaires in most classes and provided same type of instruction to all participants. Whenever this was not possible, classroom instructors were trained to administer the questionnaires. Completing the questionnaire took 15 to 20 minutes in all classes. The return rate of the questionnaires was slightly influenced by voluntary participation. After questionnaires with critical missing values, and those that were responded with an unreliable pattern (ie, rated all questions as 5 or 3), the return rate was calculated as 71.8 % (359 out of 500). By the end of the 11th week of the semester (ie, December 15, 2006), the data collection procedure was completed.
Data Analysis
In order to investigate the categories of ICT indicators, an exploratory factor analysis was conducted through SPSS 14.0 for windows. Then, a confirmatory factor analysis was conducted through LISREL 8.51.
Factor analysis is used as a data reduction technique, which takes a large set of variables, and reduces or summarizes the data using a smaller set of components (Pallant, 2001). From a structural equation modeling (SEM) point of view, it is a modeling approach for studying latent constructs by using several observable and directly measurable indicators (Raykov & Marcoulides, 2006). Factor analysis is considered exploratory when the concern is with determining how many latent constructs are needed to explain the relationships among a given set of observed indicators. The analysis, on the other hand, is confirmatory when a preexisting structure of the relationships among observed and latent variables is tested (Raykov & Marcoulides, 2006). Exploratory factor analysis has been extensively used by researchers as a tool to determine the number of underlying dimensions in a dataset (Brkich, Jeffs, & Carles, 2002). However, it fails to take into account the measurement error (Brkich, et al. 2002; Raykov & Marcoulides, 2006; Rubio & Gillespie, 1995). Theoretically, confirmatory factor analysis is conducted to test a theory-driven model with observed variables. However, it is too difficult to specify a complete model before analyzing data since theories are poorly developed or even nonexistent (Raykow & Marcoulides, 2006). Thus, model generation is observed as a common situation in empirical research studies (Jöreskog & Sörbom, 1993; Marcoulides, 1989; Raykow & Marcoulides, 2006). The current study represents a model generating situation where an initial model is specified, unsatisfactory fit to the data is modified, and repeatedly tested till acceptable concurrence between the data and the model is obtained.
RESULTS
Before conducting the analysis, the suitability of data for factor analysis was assessed. The first concern is the sample size. Kass and Tinsley (1979) suggest having between 5 and 10 subjects per items of the scale up to a total of 300. If the number reaches up to 300, test parameters tend to be stable regardless of the subject to variable ratio. Field (2000) and Tabachnick and Fidell (1966) claim that it is plausible to have at least 300 cases for factor analysis. Finally, Comrey and Lee (1992) believe that 100 is poor sample size, 300 is good, and 1000 is excellent. Therefore, it can be said that the current data is suitable for factor analysis for it includes 359 participants. However, in structural equation modeling, sample size is a controversial issue (Tanaka, 1987). Precautions of the current study in terms of sample size are justified through conducting maximum likelihood (ML) as discussed in the following paragraphs.
First of all, Kaiser-Meyer-Oklin Measure of Sampling Adequacy was checked. This statistic is calculated for individual and multiple variables and represents the ratio of the squared correlation between variables to the squared partial correlation between variables (Field, 2000). The KMO value varies between 0 and 1. A value of 0 indicates that the sum of partial correlations is large relative to the sum of correlations. A value close to 1 indicates that patterns of correlations are compact, and so factor analysis will yield reliable factors. Kaiser (1974) suggests that values greater than 0.5 should be accepted. Pallant (2001) claims that the KMO statistic should be larger than 0.6. Hutcheson and Sofroniou (1999) suggest that values between 0.5 and 0.7 are normal, values between 0.7 and 0.8 are good, values between 0.8 and 0.9 are great, and values above 0.9 are superb. The initial solution of our factor analysis revealed a KMO value of 0.848 which is great according to Hutcheson and Sofroniou (1999). Finally, Bartlett's Test of Sphericity should reach a significance value to support the factorability of the correlation matrix obtained from the items. Bartlett's Test of Sphericity revealed an Approx. Chi-Square value of 6755.498 with a significance value of .0005, which meant that the factorability of our correlation matrix was proper.
The maximum likelihood (ML) analysis revealed the presence of 13 components with eigenvalues exceeding 1 (Kaiser, 1960), which explained 62.967 % of the total variance. In the current data, it was possible to apply principal component analysis which was popular and easy to interpret (Pallant, 2001). However, in order to realize confirmative factor analysis as a next step, the assumption of multivariate normal distribution was given utmost importance. ML estimation is considered more robust to the effect of small sample sizes (Tanaka, 1987). It was also shown that ML estimates are least affected in comparison to alternative methods used for non-normal samples (Tanaka, 1984). Finally, ML provides a strong and more appropriate test to determine how many factors underlie the data (Kroonenberg & Lewis, 1982). Thus, items of the scale were examined through the ML extraction method.
Field (2000) suggests that loadings less than 0.4 be suppressed in the output. Besides, Pallant (2001) claims that if items load above 0.3, this is a strong loading which should not be deleted. Most items had loadings above 0.3, and variables with lesser values have been deleted from the analysis. Moreover, items with very close loadings in different components (ie, less than .01) were also suppressed from the analysis. The factor analysis was repeated revealing 10 factors. The analysis with the new set of items revealed a better KMO value (.878) along with an ideal Bartlett value (p< .0005) again as can be seen in Table 2.
Table 2. KMO and Bartlett's Test
Kaiser-Meyer-Oklin measure of sampling adequacy |
.878 |
Bartlett's Test of Sphericity |
Approximate c2 |
7442.246 |
Df |
990 |
Significance |
.000 |
The Cronbach's Alpha (a) of the instrument was .888 after problematic statements with inappropriate loadings were suppressed from further analyses. The analysis explained 61.687 % of the total variance in the initial solution, and 51.557 % of the total variance after rotation. In fact, the higher the variability explained by the factor analysis, the stronger the factor structure of the scale is. However, values ranging from 40 % to 60 % are considered acceptable for social studies (Dunteman, 1989). Thus, the variance explained in the current study is considered appropriate. The results of the factor analysis regarding the total variance explained are provided in Table 3.
As mentioned above, the number of factors was determined as ten. The next step was to interpret them. To assist in this process, the factors should be 'rotated' (Pallant, 2001). Ten components were extracted and rotated. There are a number of different rotation techniques. In our example, Direct Oblimin, which serves as a method for oblique (nonorthogonal) rotation was chosen. Ten factors were labeled as the following: (1) Ease of use (eigenvalue: 10,173), (2) teaching – learning method (eigenvalue: 4,297), (3) ethics (eigenvalue: 3,504), (4) special needs (eigenvalue: 1,905), (5) infrastructure (eigenvalue: 1,616), (6) professional development (eigenvalue: 1,574), (7) access (eigenvalue: 1,338), (8) health (eigenvalue: 1,216), (9) policy (eigenvalue: 1,089) and (10) ICT in curriculum context (eigenvalue: 1,047).
Table 3. Results of the factor analysis: Total variance explained
Factor |
Initial Eigenvalues |
Extraction Sums of Squared Loadings |
Rotation Sums of Squared Loadings |
Total |
% of Variance |
Cumulative % |
Total |
% of Variance |
Cumulative % |
Total |
% of Variance |
Cumulative % |
1 |
10,173 |
22,606 |
22,606 |
9,556 |
21,236 |
21,236 |
5,141 |
11,424 |
11,424 |
2 |
4,297 |
9,548 |
32,154 |
3,827 |
8,504 |
29,740 |
4,121 |
9,157 |
20,581 |
3 |
3,504 |
7,787 |
39,941 |
2,634 |
5,854 |
35,593 |
2,685 |
5,966 |
26,546 |
4 |
1,905 |
4,234 |
44,175 |
1,773 |
3,939 |
39,532 |
2,409 |
5,352 |
31,899 |
5 |
1,616 |
3,592 |
47,768 |
1,358 |
3,017 |
42,549 |
2,137 |
4,749 |
36,648 |
6 |
1,574 |
3,497 |
51,265 |
1,124 |
2,498 |
45,047 |
1,700 |
3,778 |
40,426 |
7 |
1,338 |
2,974 |
54,239 |
0,895 |
1,990 |
47,037 |
1,569 |
3,486 |
43,912 |
8 |
1,216 |
2,702 |
56,941 |
0,820 |
1,822 |
48,859 |
1,372 |
3,048 |
46,960 |
9 |
1,089 |
2,420 |
59,361 |
0,649 |
1,442 |
50,301 |
1,096 |
2,435 |
49,395 |
10 |
1,047 |
2,326 |
61,687 |
0,565 |
1,256 |
51,557 |
0,973 |
2,162 |
51,557 |
11 |
0,995 |
2,212 |
63,899 |
|
|
|
|
|
|
12 |
0,955 |
2,122 |
66,021 |
|
|
|
|
|
|
13 |
0,890 |
1,979 |
68,000 |
|
|
|
|
|
|
14 |
0,854 |
1,898 |
69,898 |
|
|
|
|
|
|
15 |
0,805 |
1,788 |
71,687 |
|
|
|
|
|
|
(Subsequent rows are omitted to save space)
Interestingly, only two predetermined factors, "learning communities" and "technical assistance", were not revealed by the current analysis. Items included in each factor, internal consistency coefficients of factors, item means and standard deviations, component loadings and Direct Oblimin Rotation loadings are provided in table 4.
Table 4. Means, standard deviations, internal consistency coefficients of factors, component and rotation loadings:
Items and Factors
|
Mean |
SD |
Component factor load |
Direct Oblimin factor load |
Factor 1: Ease of Use (a=,810) |
44 |
There are user manuals for technological devices I use. |
1,955 |
1,077 |
,510 |
,768 |
49 |
Whenever I have problems with technological devices, there are warnings and user manuals to help me with what to do. |
2,034 |
,997 |
,613 |
,680 |
45 |
I can find devices like scanner, printer and video camera whenever I want. |
2,051 |
1,123 |
,531 |
,589 |
48 |
Whenever I have a problem in laboratories or technology classrooms, I get quick and efficient technical assistance. |
2,392 |
1,065 |
,629 |
,493 |
43 |
There are warnings and explanations in technology classrooms which help me use the devices easily. |
2,449 |
1,032 |
,577 |
,414 |
Factor II: Teaching – Learning Method (a=,855) |
18 |
Instructors serve as models about how to use computers salubriously. |
2,045 |
1,048 |
,499 |
,699 |
19 |
Instructors create environments where we could use technology for communication and problem solving. |
2,459 |
1,053 |
,585 |
,545 |
20 |
Instructors model us in using technology for instructional endeavors. |
2,790 |
1,039 |
,586 |
,503 |
22 |
Instructors use computer software during classes. |
2,494 |
1,075 |
,566 |
,453 |
17 |
Instructors use technology to realize class activities. |
3,101 |
,937 |
,513 |
,400 |
25 |
Instructors select and use technologies according to our needs. |
2,909 |
1,032 |
,557 |
,362 |
Factor III: Ethics (a=,747) |
11 |
(reverse coded) I can help my friends with their assignments even though we are asked to study individually. |
3,510 |
,978 |
,550 |
,688 |
10 |
(reverse coded) I can get help from my friends with my assignments even though we are asked to study individually. |
3,717 |
,998 |
,430 |
,634 |
5 |
(reverse coded) Students share their assignments and use each other's ideas. |
3,503 |
1,317 |
,652 |
,622 |
12 |
(reverse coded) There are instances where students use similar assignments for different classes. |
4,123 |
,981 |
,551 |
,513 |
4 |
(reverse coded) Students use Internet resources without acknowledging the resource. |
3,474 |
1,160 |
,501 |
,433 |
Factor IV: Special Needs (a=,855) |
52 |
There are instructional materials suitable for handicapped students. |
1,867 |
,986 |
,591 |
,898 |
51 |
Classrooms are suitable for handicapped students. |
1,856 |
1,066 |
,587 |
,845 |
53 |
There are sufficient personnel responsible for the problems of handicapped students. |
1,913 |
,959 |
,573 |
,649 |
50 |
Tables and chairs we use are suitable to use computers salubriously. |
2,339 |
1,147 |
,584 |
,509 |
Factor V: Infrastructure (a=,824) |
47 |
Internet speed is sufficient in our campus. |
2,972 |
1,221 |
,482 |
,766 |
37 |
Computers are fast enough to use for instructional activities. |
2,562 |
1,171 |
,521 |
,529 |
46 |
I can use Internet on campus whenever I want. |
2,941 |
1,279 |
,497 |
,503 |
40 |
There are sufficient opportunities to improve my technology knowledge |
2,483 |
1,105 |
,661 |
,361 |
41 |
Classrooms, lighting, air condition and arrangement are suitable for instruction. |
3,130 |
1,083 |
,512 |
,343 |
54 |
There are sufficient licensed software programs. |
2,526 |
1,067 |
,503 |
,343 |
39 |
Sufficient technology training is provided |
2,291 |
,982 |
,658 |
,321 |
Factor VI: Professional Development (ie, obsolescence) (a=709) |
23 |
(reverse coded) Instructors do not use course materials except for the blackboard and chalks. |
3,545 |
1,182 |
,526 |
-,838 |
24 |
(reverse coded) Instructors do not need computer assisted instruction in teaching most subjects. |
3,703 |
1,126 |
,569 |
-,741 |
15 |
(reverse coded) Instructors lecture through traditional methods since they are not proficient in technology |
3,290 |
,999 |
,536 |
-,381 |
Factor VII: Access (a=,819) |
35 |
There are sufficient computer laboratories. |
1,958 |
1,091 |
,589 |
-,910 |
36 |
There are sufficient computers for us. |
1,867 |
1,087 |
,594 |
-,885 |
42 |
Technology classrooms and laboratories are available whenever I need. |
2,365 |
1,148 |
,586 |
-,382 |
Factor VIII: Health (a=,777) |
7 |
(reverse coded) I know students who have insomnia stemming from excessive computer use. |
3,941 |
1,221 |
,605 |
-,824 |
6 |
(reverse coded) I know students who have physical problems stemming from excessive computer use (e.g. pain, posture problems, spasms, cramps) |
4,017 |
1,114 |
,604 |
-,747 |
Factor IX: Policy (a=,689) |
34 |
Administrators ask our opinions for their innovative applications. |
1,875 |
1,031 |
,579 |
,677 |
33 |
We are informed about the administration's prospective technological endeavors. |
2,437 |
1,169 |
,476 |
,650 |
Factor X: ICT in curriculum context (a=,743) |
27 |
Instructors use Internet resources for teaching – learning endeavors. |
3,138 |
1,031 |
,487 |
,697 |
28 |
Instructors give assignments that lead us to use Internet resources. |
3,473 |
1,053 |
,365 |
,672 |
26 |
Instructors try to use motivating instructional technologies. |
2,751 |
,999 |
,599 |
,334 |
29 |
Instructors announce the course materials and technology they are going to use in their classes. |
2,561 |
1,098 |
,508 |
,329 |
After the exploratory factor analysis, items revealed by the analysis were further processed through LISREL 8.51 (Jöreskog & Sörbom, 2001) to conduct a confirmatory factor analysis. The solution with 10 latent and 41 observed variables suggested in Table 4 was examined. A chi-square value (χ²) of 1711.31 with a corresponding df value of 734 was found (p<.0001). The ratio of df to χ² value was 2.333 which was acceptable, but slightly above the ideal ratio (ie, 2). The Akaike information criterion (AIC) which takes into account the measure of fit along with the model complexity was checked next (Akaike, 1987). Generally, models with lower values of AIC and CAIC are considered better means of data description than models with higher indexes (Raykov & Marcoulides, 2006). Even though the model CAIC (2588.98) was smaller than the saturated CAIC (5950.20) as desired, model AIC (1965.31) was larger than the saturated AIC (1722.00), which was problematic. The root mean square error of approximation (RMSEA) was .06 which was marginally above the acceptable value (ie, .05). In fact, some researchers suggest that a RMSEA value of .08 and below represents a reasonable fit (Browne & Cudeck, 1993). However, the current study looks for a more conservative and robust fit at a level of .05 or below. Besides, the most current resources suggest that RMSEA be smaller than .05 to have a pertinent model (Raykov & Marcoulides, 2006).
Goodness of fit indices were not higher than the suggested ideal value .90 (Bentler & Bonett, 1980). More specifically, non-normed fit index (NNFI) was .83, comparative fit index (CFI) was .85, and incremental fit index (IFI) was .85. Particularly, the CFI is considered to show a good fit when it is .90 or higher (Bentler, 1995). Thus, modifications suggested by the program were conducted as follows:
Paths to question 42 from infrastructure, ease of use, and special needs were suggested. The measurement tool was examined and it was observed that the suggestions indicated a plausible path. Thus, one-way paths from infrastructure, ease of use, and special needs were drawn to question 42. The program was run again and the ratio of df to χ² value was improved to 2.25. When this problematic question was removed from the scale, the ratio was improved to 2.23 and RMSEA value was improved to .058. Thus, question 42 was removed from the scale. Better questions measuring access, ease of use, infrastructure and special needs independent from each other were necessary.
Question 47 also seemed problematic and deleted from the instrument since it had relationships with teaching-learning method, access, policy and ICT in curriculum context. The analysis after this deletion revealed a χ² of 1387.46 with a corresponding df of 657. The df to χ2 ratio was almost ideal (ie, 2.11). Question 50 was removed from the measurement tool as well, since it had relationships with ease of use, infrastructure and special need simultaneously. The final model revealed a χ² of 1297.79 with a corresponding df of 620. The df to χ2 ratio was reduced to 2.09.
After above modifications, non-normed fit index (NNFI) increased to .87, comparative fit index (CFI) increased to .88 and incremental fit index (IFI) became .89. Further deletions did not improve χ2 any further. Thus, as suggested by the program, an error covariance between question 27 and 28 was added. This modification revealed a χ² of 1230.94 with a corresponding df of 619. The df to χ2 ratio was appropriate (ie, 1.989). Finally, an error covariance between questions 25 and 26 was added as suggested by the program. This final modification revealed a χ² of 1193.89 with a corresponding df of 618. The df to χ2 ratio decreased to 1.93.
When modifications were completed, the RMSEA was .05 as desired. Most goodness of fit indices were ideal as well (NNFI: .89; CFI: .90; IFI: .90.). In brief, after the confirmatory factor analysis, 42nd, 47th and 50th questions were removed. Besides, error covariances between 27th and 28th questions and between 25th and 26th questions were added. None of t values below the critical value at a probability level of .01 was taken into account (2.576). Latent variables, observed variables, standardized solutions and t values are reported in Table 5. Besides, Figure 1 illustrates the results of the confirmatory factor analysis.
Table 5. Variables, t values, standardized solutions and error variances
Latent Variable |
Observed Variables |
t-value of the Path |
Standardized Solution |
Error Variance |
Ease of Use
(a=,810) |
Question 43 |
11,96 |
0,60 |
0,64 |
Question 44 |
13,41 |
0,66 |
0,56 |
Question 45 |
12,76 |
0,64 |
0,60 |
Question 48 |
15,43 |
0,74 |
0,46 |
Question 49 |
16,57 |
0,77 |
0,40 |
Teaching – Learning Method
(a=,855) |
Question 17 |
12,75 |
0,63 |
0,61 |
Question 18 |
11,83 |
0,59 |
0,65 |
Question 19 |
16,84 |
0,77 |
0,41 |
Question 20 |
17,90 |
0,80 |
0,35 |
Question 22 |
14,84 |
0,70 |
0,50 |
Question 25 |
14,80 |
0,70 |
0,51 |
Ethics
(a=,747) |
Question 4 |
9,93 |
0,54 |
0,71 |
Question 5 |
13,17 |
0,68 |
0,53 |
Question 10 |
10,80 |
0,58 |
0,66 |
Question 11 |
13,11 |
0,68 |
0,54 |
Question 12 |
11,14 |
0,60 |
0,65 |
Special Needs
(a=,866) |
Question 51 |
19,40 |
0,85 |
0,27 |
Question 52 |
21,27 |
0,91 |
0,18 |
Question 53 |
15,94 |
0,74 |
0,45 |
Infrastructure
(a=,794) |
Question 54 |
11,11 |
0,57 |
0,67 |
Question 37 |
11,41 |
0,58 |
0,66 |
Question 39 |
13,89 |
0,68 |
0,53 |
Question 40 |
16,79 |
0,78 |
0,38 |
Question 41 |
10,65 |
0,55 |
0,70 |
Question 46 |
10,62 |
0,55 |
0,70 |
Professional Development
(a=709) |
Question 15 |
9,75 |
0,53 |
0,71 |
Question 23 |
14,49 |
0,76 |
0,42 |
Question 24 |
14,27 |
0,75 |
0,44 |
Access
(a=,898) |
Question 35 |
20,39 |
0,92 |
0,16 |
Question 36 |
19,57 |
0,89 |
0,21 |
Health
(a=,777) |
Question 6 |
13,62 |
0,78 |
0,40 |
Question 7 |
14,03 |
0,80 |
0,35 |
Policy
(a=,689) |
Question 33 |
11,46 |
0,63 |
0,61 |
Question 34 |
14,74 |
0,84 |
0,30 |
ICT in Curriculum Context
(a=,743) |
Question 26 |
16,92 |
0,79 |
0,37 |
Question 27 |
12,57 |
0,63 |
0,60 |
Question 28 |
6,76 |
0,37 |
0,86 |
Question 29 |
11,47 |
0,58 |
0,66 |
The final version of the scale consisted of 38 items with an ideal overall alpha (a=.874). There are reverse coded items as also specified in Table 4, which should be processed with caution by practitioners. Besides, some components have only two items. Further studies might add new items to these constructs to further develop the instrument. The maximum possible score of the scale is 190 and the minimum score is 38. The mean of the sample was 105.131 with a standard deviation of 17.234. Skewness (.068) and kurtosis values (-.270) were within the limits of a normally distributed sample (Huck, 2000). Besides, both Kolmogorov-Smirnov and Shapiro-Wilk Tests of Normality revealed that the distribution was normal (Kolmogorov-Smirnov statistic: .028, p=.200; Shapiro-Wilk statistic: .997; p=.789). Descriptives of the sample are provided in Table 6.
Table 6. Descriptives of the sample group
|
|
Statistic |
Std. Error |
Mean |
|
105,131 |
0,91 |
95% Confidence Interval for Mean |
Lower Bound |
103,342 |
|
|
Upper Bound |
106,92 |
|
5% Trimmed Mean |
|
105,042 |
|
Median |
|
105 |
|
Variance |
|
297,023 |
|
Std. Deviation |
|
17,234 |
|
Minimum |
|
61 |
|
Maximum |
|
152 |
|
Range |
|
91 |
|
Interquartile Range |
|
24 |
|
Skewness |
|
0,068 |
0,129 |
Kurtosis |
|
-0,27 |
0,257 |
This section provided statistical analyses conducted to increase the validity and reliability of the ICTIMS whose results reflected the characteristics of a normal distribution. The authors suggest that total scores of the scale be used after reverse coded items are processed. Individual explorations for each factor could also be conducted to see aspects of ICT integration that need immediate action. Since further confirmatory analyses to investigate second-order relationships were not yet conducted, and since the relationships among sub-competencies of UNESCO (2002) were not investigated through pertinent structural equation models, it is suggested that total scores calculated for part of the individual factors not used.
DISCUSSION
The current study sets out to generate a measurement tool for investigating indicators of information and communication technologies. Authors had 12 factors and more than a hundred statements at the inception of the development process, and completed the instrument through expert panels, and exploratory and confirmatory factor analyses which identified 10 predetermined factors indicated by a total of 38 questions.
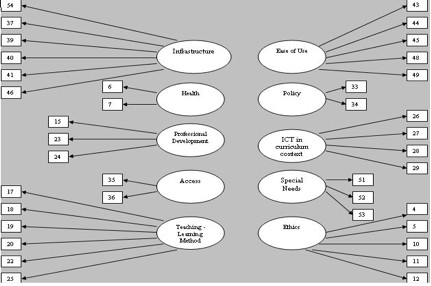
Figure 1.Summary of the confirmatory factor analysis
Items of technical assistance were somewhat merged with indicators of access, ease of use and infrastructure. This was not an extraordinary situation since these subcategories all belonged to the construct of technical issues as mentioned in the literature review. Moreover, none of the items addressing learning communities had appropriate loadings to be included in the final version of the scale. Perhaps, items of learning community were shadowed by those of professional development. This was an expected situation as well, since both professional development and learning communities are examined as subcategories of the same construct (i.e., collaboration and networking). New questions could be added to the scale to address technical assistance and learning communities more effectively. An interesting controversy to bear in mind is that professional development is mentioned under the construct of technical issues by UNESCO (2002). If this approach is taken for granted, one might suggest that the current study did not reveal factors related to collaboration and networking. Naming factors in accordance with observed variables is open to further discussion and scrutiny.
Some privileged studies conducted through structural equation modeling in the literature tend to conduct factor analysis on the first subset of a large sample, and SEM on a second subset (Creed & Machin, 2003; Inglés, Hidalgo, & Méndez, 2005). However, it is also acceptable to conduct both analyses on the same data as done by Brkich et al. (2002). The analysis conducted with a single sample in the current study demonstrates first-order relationships between sub-categories of UNESCO (2002)'s four competencies and observed variables. Further analyses with new samples could be conducted to see the relationships between four competencies and subcategories, and between subcategories and observed variables, which can reveal second-order relationships. Moreover, through administering the current scale across different populations, the tool might be developed further, so that structural equation models can be suggested among reliably measured constructs.
As mentioned before, the reference population of the study was senior students of the Faculty of Education at Anadolu University, Turkey. The scale should be used with larger samples across different faculties aside from the education faculty to develop its construct validity and generalize the results to a larger reference population. For example, Akpinar (2003) reported differences in technology using behaviors of K-12 teachers within and outside classroom in accordance with the program they graduated from. Since the current data were collected from an opportunity sample which was a single Turkish state university, generalizations to other state universities based on the current dataset could only be suggestive rather than definitive. Besides, the ICTIMS investigate ICT indicators from senior students' points of view. A parallel form of the questionnaire could be developed for instructors to scrutinize their perspectives in terms of content and pedagogy, collaboration and networking, social and health issues, and technical issues.
The authors of the current study prepare to administer the ICTIMS across senior students of all education faculties in Turkey, which will lead to scrutinized knowledge on the ICT situation of educational faculties and prospective teachers. Besides, collaboration among European universities within the scope of a joint project like SEUSISS (Haywood, 2003) might lead practitioners to invaluable information about the ICT situation across European universities.
REFERENCES
Akaike, H. (1987). "Factor analysis and AIC". Psychometrika, 52, 317-332.
Akpinar, Y. (2003). "Öğretmenlerin yeni bilgi teknolojileri kullanımında yükseköğretimin etkisi: İstanbul okulları örneği (Effects of the undergraduate education on teachers' use of new information technologies: Istanbul schools' case)". The Turkish Online Journal of Educational Technology, 2 (2), Article 11.
Bentler, P. M. (1995). EQS structural equations program manual. Encino, CA: Multivariate Software, Inc.
Bentler, P. M., & Bonett, D. G. (1980). "Significance tests and goodness of fit in the analysis of covariance structures". Psychological Bulletin, 88, 588-606.
Billig, S. H. (2002). "Adoption, implementation, and sustainability of K-12 service-learning". In A. Furco & S. H. Billig (Eds.), Service-learning: the essence of the pedagogy Vol. 1, Advances in service learning (pp. 245-267). Greenwich, CT: Information Age Publishers.
Billig, S. H., Sherry, L, & Havelock, B. (2005). "Challenge 98: sustaining the work of a regional technology integration initiative". British Journal of Educational Technology, 36 (6), 987-1003.
Brkich, M., Jeffs, D., & Carless, S. A. (2002). "A global self-report measure of person-job fit". European Journal of Psychological Assessment, 18 (1), 43-51.
Browne, M. W., & Cudeck, R. (1993). "Alternative ways of assessing model fit". In K. A. Bollen & J. S. Long (Eds), Testing structural equation models (pp.136-162). Newbury Park, CA: Sage Publications.
Catell, R. B. (1966). "The scree test for number of factors". Multivariate Behavioral Research, 1, 245-276.
Commission of the European Communities. (2002). European report on quality indicators of lifelong learning: Fifteen quality indicators. Brussels: Commission of the European Communities.
Comrey, A. L. & Lee, H. B. (1992). A first course in factor analysis (2nd edition). Hillsdale, NJ: Erlbaum.
Creed, P. A., & Machin, M. A. (2003). "Multidimensional properties of the access to categories of experience scale". European Journal of Psychological Assessment, 19 (2), 85-91.
Demiraslan, Y., & Usluel, Y. K. (2005). "Bilgi ve iletişim teknolojilerinin öğrenme öğretme sürecine entegrasyonunda öğretmenlerin durumu (Teachers' situation in the process of the integration of information and communication technologies to learning and teaching process)". The Turkish Online Journal of Educational Technology, 4 (3), Article 15.
Dunteman, G. H. (1989). Principal component analysis. Quantitative applications in the social sciences series (vol. 69). Thousand Oaks, CA: Sage Publications.
Field, A. (2000). Discovering statistics using SPSS for windows. London: Sage Publications.
Gibson, I. S., O'Reilly, C., & Hughes, M. (2002). "Integration of ICT within a project-based learning environment". European Journal of Engineering Education, 27 (1), 21-30.
Haywood, D. (2003). Confidence, experience and attitudes of undergraduate students towards ICT. Survey of European Universities Skills in ICT of Students and Staff (SEUSISS) [WWW document]. URL http://www.elearningeuropa.info/index.php?page=doc&doc_id=4097&doclng=1
Hennessy, S, Ruthven, K, & Brindley, S. (2005). "Teacher perspectives on integrating ICT into subject teaching: commitment, constraints, caution and change". Journal of Curriculum Studies, 37 (2), 155-192.
Huck, S. W. (2002). Reading statistics and research. New York: Addison Wesley Longman.
Hutcheson, G., & Sofroniou, N. (1999). The multivariate social scientist. London: Sage.
Inglés, C. J., Hidalgo, M. D., & Méndez, F. X. (2005). "Interpersonal difficulties in adolescence: A new self-report measure". European Journal of Psychological Assessment, 21 (1), 11-22.
Jöreskog, K. G., & Sörbom, D. (1993). LISREL8: User's reference guide. Chicago, IL: Scientific Software, Inc.
Jöreskog, K. G., & Sörbom, D. (2001). LISREL 8.51. Chicago, IL: Scientific Software, Inc.
Jung, I. (2005). "ICT-pedagogy integration in teacher training: application cases worldwide". Educational Technology & Society, 8 (2), 94-101.
Kaiser H. F. (1960). "The application of electronic computers to factor analysis". Educational and Psychological Measurement, 20, 141-151.
Kaiser, H. F. (1974). "An index of factorial simplicity". Psychometrika, 39, 31-36.
Kass, R.A., & Tinsley, H. E. A. (1979). "Factor analysis". Journal of Leisure Research, 11, 120-138.
Kroonenberg, P. M., & Lewis, C. (1982). "Methodological issues in the search for a factor model: Exploration through confirmation". Journal of Educational Statistics, 7 (2), 69-89.
Lin, L. J. C. (2005). "Development of a questionnaire for determining the factors in technology integration among teachers". Journal of Instructional Psychology, 32 (4), 287-292.
Liu, Y., & Huang, C. (2005). "Concerns of teachers about technology integration in the USA". European Journal of Teacher Education, 28 (1), 35-47.
Marcoulides, G. A. (1989). "Structural equation modeling for scientific research". Journal of Business and Society, 2 (2), 130-138.
Odabasi, F., Akbulut, Y., Cuhadar, C., Dursun, Ö. Ö., Kabakci, I., Kilicer, K., Kurt, A. A., Sendag, S., & Tanyeri, T. (2006). Turkey basic education project: Baseline study on ICT integration. Ankara: Ministry of National Education Projects Coordination Center [WWW document]. URL http://home.anadolu.edu.tr/~fodabasi/doc/ey6.swf
Pallant, J. (2001). SPSS survival manual. Maidenhead, PA: Open University Press.
Raykov, T., & Marcoulides, G. A. (2006). A first course in structural equation modeling. Mahwah, NJ: Lawrence Erlbaum Associates.
Richards, C. (2004). "From old to new learning: Global imperatives, exemplary Asian dilemmas and ICT as a key to cultural change in education". Globalization, Societies and Education, 2 (3), 337-353.
Rubio, D. M., & Gillespie, D. F. (1995). "Problems with error in structural equation models". Structural Equation Modeling, 2, 367-378.
Smith, S. J., & Robinson, S. (2003). "Technology integration through collaborative cohorts: Preparing future teachers to use technology". Remedial and Special Education, 24 (3), 154-160.
Tabachnick, B. G: & Fidell, L. S. (1996). Using multivariate statistics (3rd edition). New York: Harper & Row.
Tanaka, J. S. (1984). "Some results on the estimation of covariance structure models". Dissertation Abstracts International, 45, 924B.
Tanaka, J. S. (1987). "How big is big enough? Sample size and goodness of fit in structural equation models with latent variables". Child Development, 58 (1), 134-146.
Toledo, C. (2005). "A five-stage model of computer technology integration into teacher education curriculum". Contemporary Issues in Technology and Teacher Education, 5 (2), 177-191.
UNESCO (2002). Information and communication technologies in teacher education: A planning guide [WWW document]. URL http://unesdoc.unesco.org/images/0012/001295/129533e.pdf.
Copyright for articles published in this journal is retained by the authors, with first publication rights granted to the journal. By virtue of their appearance in this open access journal, articles are free to use, with proper attribution, in educational and other non-commercial settings. Original article at: http://ijedict.dec.uwi.edu//viewarticle.php?id=359&layout=html
|